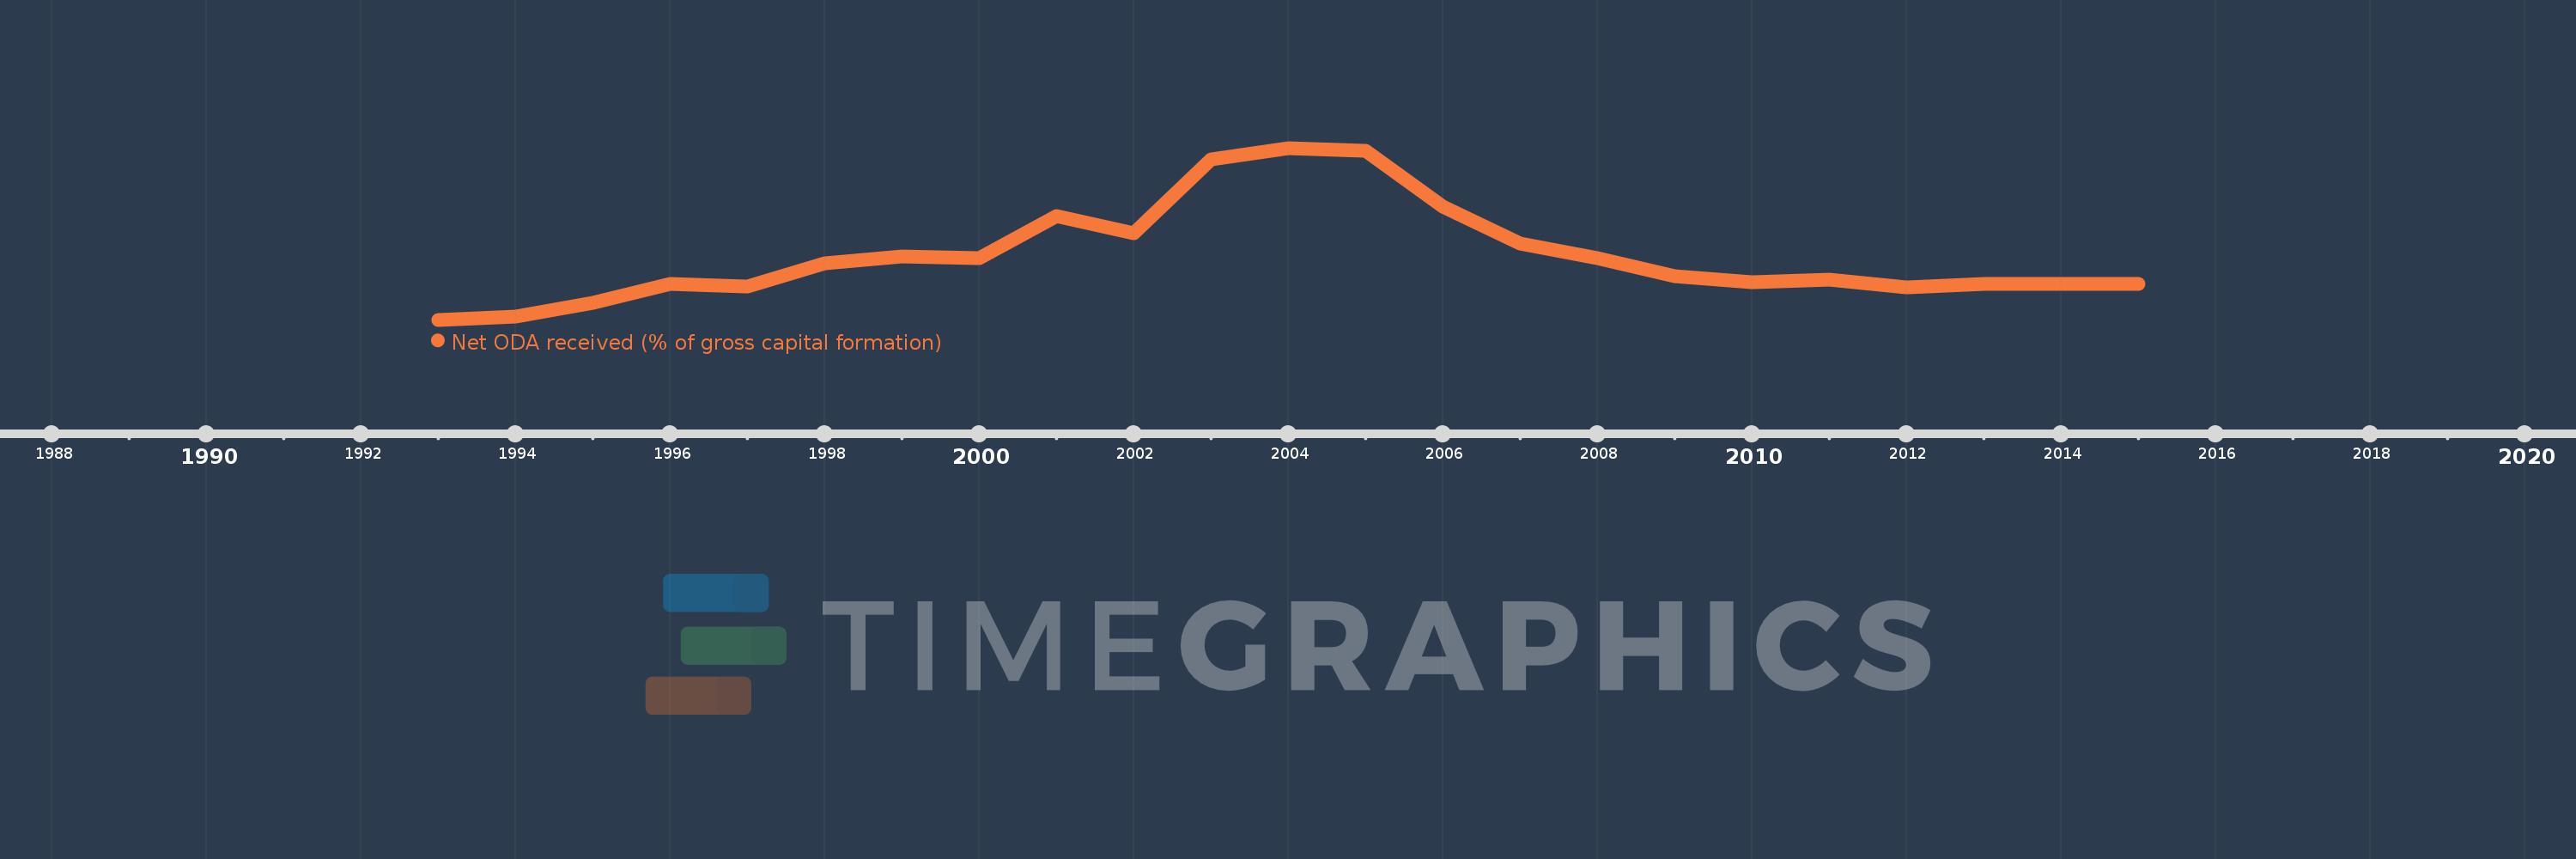
This timeline shows a graph from 1993 to 2015 of Uzbekistan. No data until 1992. Number of actual observations by date: 23.
Source name:
World Development Indicators
Source organization:
Development Assistance Committee of the Organisation for Economic Co-operation and Development, Geographical Distribution of Financial Flows to Developing Countries, Development Co-operation Report, and International Development Statistics database. Data are available online at: www.oecd.org/dac/stats/idsonline. World Bank gross capital formation estimates are used for the denominator.
Categories, topics:
Aid Effectiveness
Last updated:
apr 23, 2017
Indicators value changes by year
Meaning:
3.782
Minimum:
0.05
jan 1, 1993
Maximum:
10.057
jan 1, 2004
At the date of observation
Value
Absolute change
Change from the previous value
jan 1, 1993
0.05
+0.05
0.0%
jan 1, 1994
0.247
+0.196
390.41%
jan 1, 1995
1.019
+0.772
313.0%
jan 1, 1996
2.126
+1.107
108.69%
jan 1, 1997
1.983
-0.143
-6.71%
jan 1, 1998
3.36
+1.377
69.43%
jan 1, 1999
3.759
+0.399
11.88%
jan 1, 2000
3.625
-0.134
-3.56%
jan 1, 2001
6.108
+2.483
68.49%
jan 1, 2002
5.093
-1.015
-16.62%
jan 1, 2003
9.392
+4.299
84.4%
jan 1, 2004
10.057
+0.665
7.09%
jan 1, 2005
9.874
-0.183
-1.82%
jan 1, 2006
6.63
-3.245
-32.86%
jan 1, 2007
4.503
-2.126
-32.07%
jan 1, 2008
3.635
-0.868
-19.28%
jan 1, 2009
2.585
-1.05
-28.88%
jan 1, 2010
2.219
-0.366
-14.16%
jan 1, 2011
2.4
+0.181
8.15%
jan 1, 2012
1.946
-0.454
-18.92%
jan 1, 2013
2.113
+0.168
8.61%
jan 1, 2014
2.137
+0.024
1.14%
jan 1, 2015
2.129
-0.008
-0.38%
Ranking of countries by current statistics by years