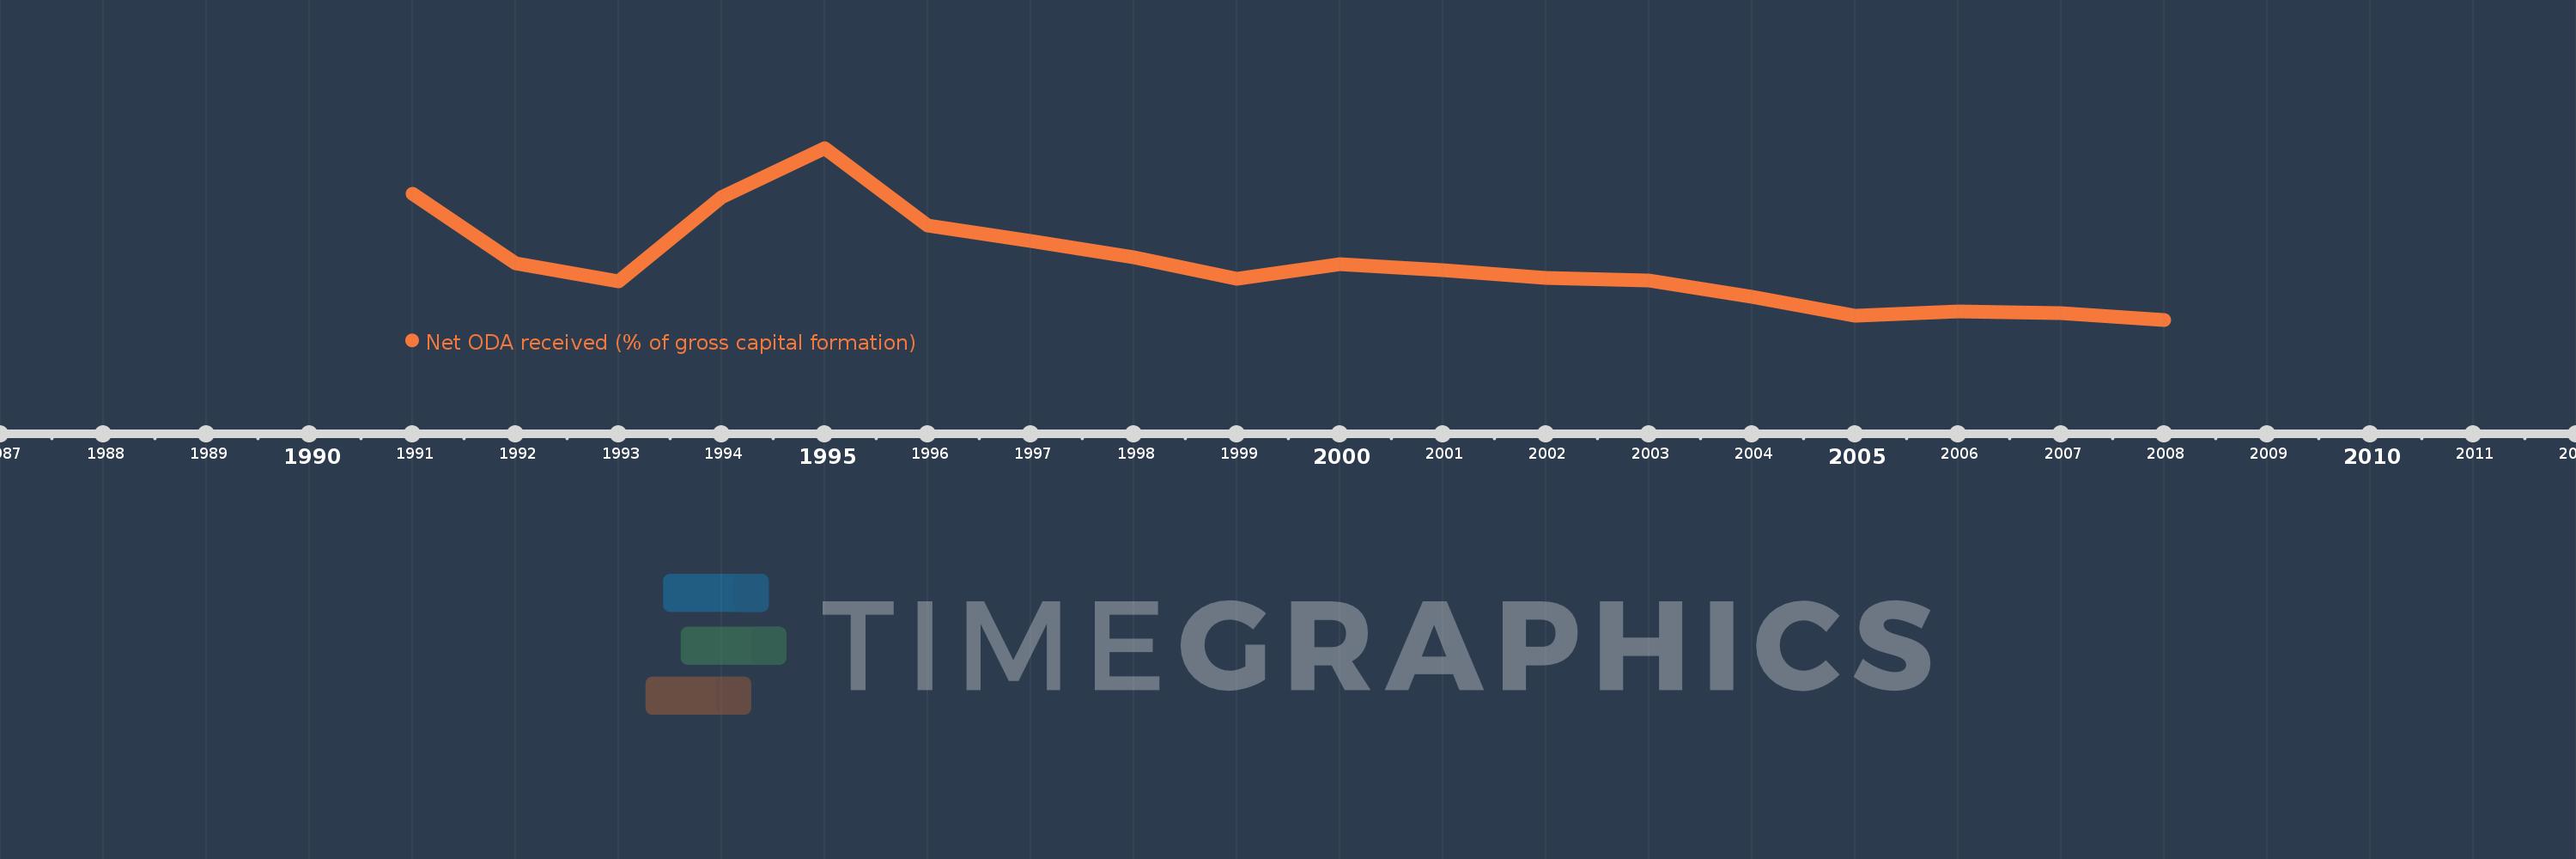
This timeline shows a graph from 1991 to 2008 of Djibouti. No data until 1990. Number of actual observations by date: 18.
Source name:
World Development Indicators
Source organization:
Development Assistance Committee of the Organisation for Economic Co-operation and Development, Geographical Distribution of Financial Flows to Developing Countries, Development Co-operation Report, and International Development Statistics database. Data are available online at: www.oecd.org/dac/stats/idsonline. World Bank gross capital formation estimates are used for the denominator.
Categories, topics:
Aid Effectiveness
Last updated:
apr 23, 2017
Indicators value changes by year
Meaning:
164.91
Minimum:
35.427
jan 1, 2008
Maximum:
427.815
jan 1, 1995
At the date of observation
Value
Absolute change
Change from the previous value
jan 1, 1991
323.48
+323.48
0.0%
jan 1, 1992
163.796
-159.684
-49.36%
jan 1, 1993
122.18
-41.616
-25.41%
jan 1, 1994
314.811
+192.632
157.66%
jan 1, 1995
427.815
+113.003
35.9%
jan 1, 1996
250.887
-176.928
-41.36%
jan 1, 1997
216.202
-34.685
-13.83%
jan 1, 1998
177.617
-38.585
-17.85%
jan 1, 1999
129.179
-48.438
-27.27%
jan 1, 2000
162.468
+33.289
25.77%
jan 1, 2001
148.87
-13.598
-8.37%
jan 1, 2002
131.635
-17.234
-11.58%
jan 1, 2003
124.735
-6.901
-5.24%
jan 1, 2004
88.684
-36.051
-28.9%
jan 1, 2005
44.763
-43.92
-49.52%
jan 1, 2006
55.116
+10.352
23.13%
jan 1, 2007
50.711
-4.404
-7.99%
jan 1, 2008
35.427
-15.284
-30.14%
Ranking of countries by current statistics by years