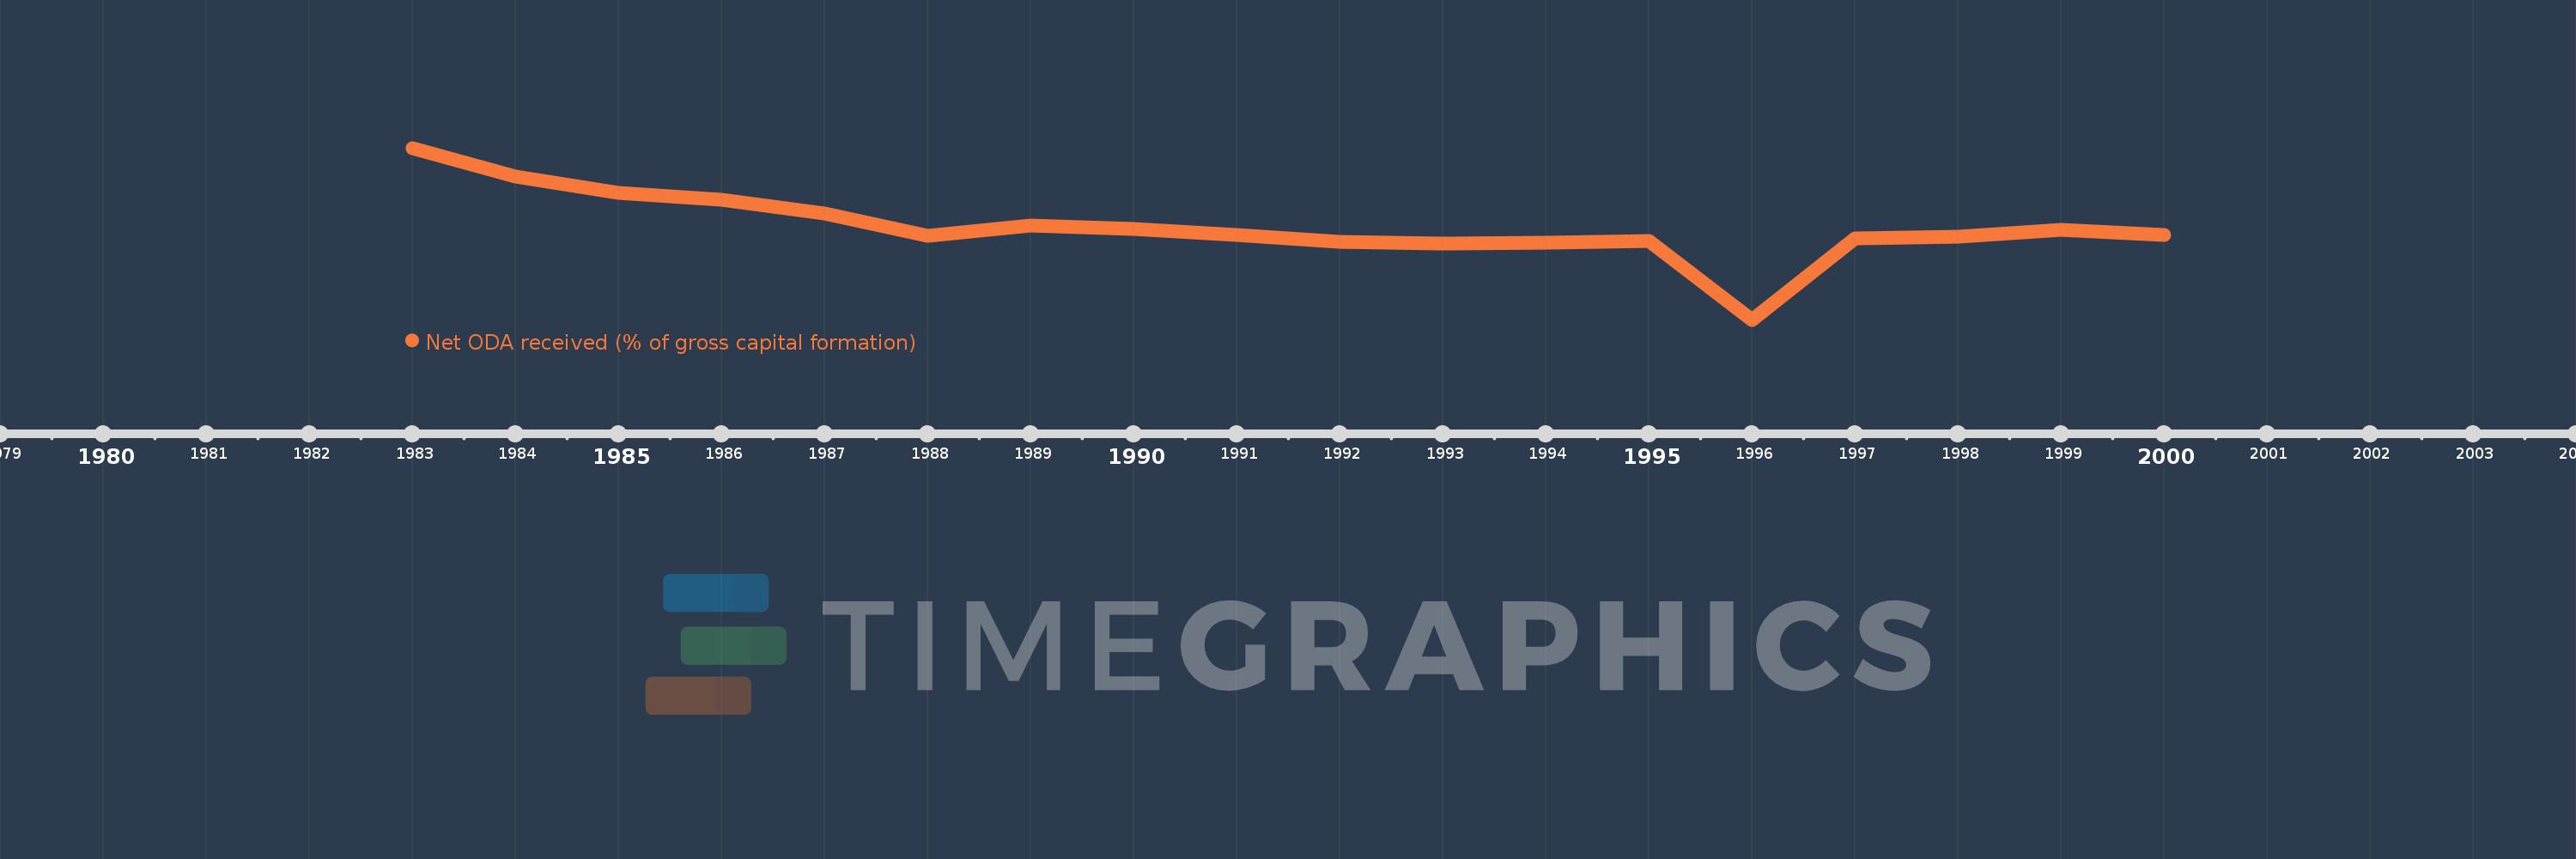
This timeline shows a graph from 1983 to 2000 of Macao SAR, China. No data until 1982. Number of actual observations by date: 18.
Source name:
World Development Indicators
Source organization:
Development Assistance Committee of the Organisation for Economic Co-operation and Development, Geographical Distribution of Financial Flows to Developing Countries, Development Co-operation Report, and International Development Statistics database. Data are available online at: www.oecd.org/dac/stats/idsonline. World Bank gross capital formation estimates are used for the denominator.
Categories, topics:
Aid Effectiveness
Last updated:
apr 23, 2017
Indicators value changes by year
Meaning:
0.055
Minimum:
-0.214
jan 1, 1996
Maximum:
0.284
jan 1, 1983
At the date of observation
Value
Absolute change
Change from the previous value
jan 1, 1983
0.284
+0.284
0.0%
jan 1, 1984
0.201
-0.083
-29.17%
jan 1, 1985
0.154
-0.047
-23.54%
jan 1, 1986
0.135
-0.019
-12.47%
jan 1, 1987
0.093
-0.042
-31.23%
jan 1, 1988
0.029
-0.064
-69.13%
jan 1, 1989
0.06
+0.032
111.18%
jan 1, 1990
0.049
-0.011
-18.44%
jan 1, 1991
0.031
-0.018
-37.46%
jan 1, 1992
0.011
-0.019
-62.83%
jan 1, 1993
0.008
-0.003
-28.44%
jan 1, 1994
0.01
+0.002
20.27%
jan 1, 1995
0.014
+0.004
44.64%
jan 1, 1996
-0.214
-0.229
-1.6K%
jan 1, 1997
0.023
+0.237
-110.52%
jan 1, 1998
0.026
+0.004
16.61%
jan 1, 1999
0.046
+0.019
73.31%
jan 1, 2000
0.031
-0.015
-32.83%
Ranking of countries by current statistics by years