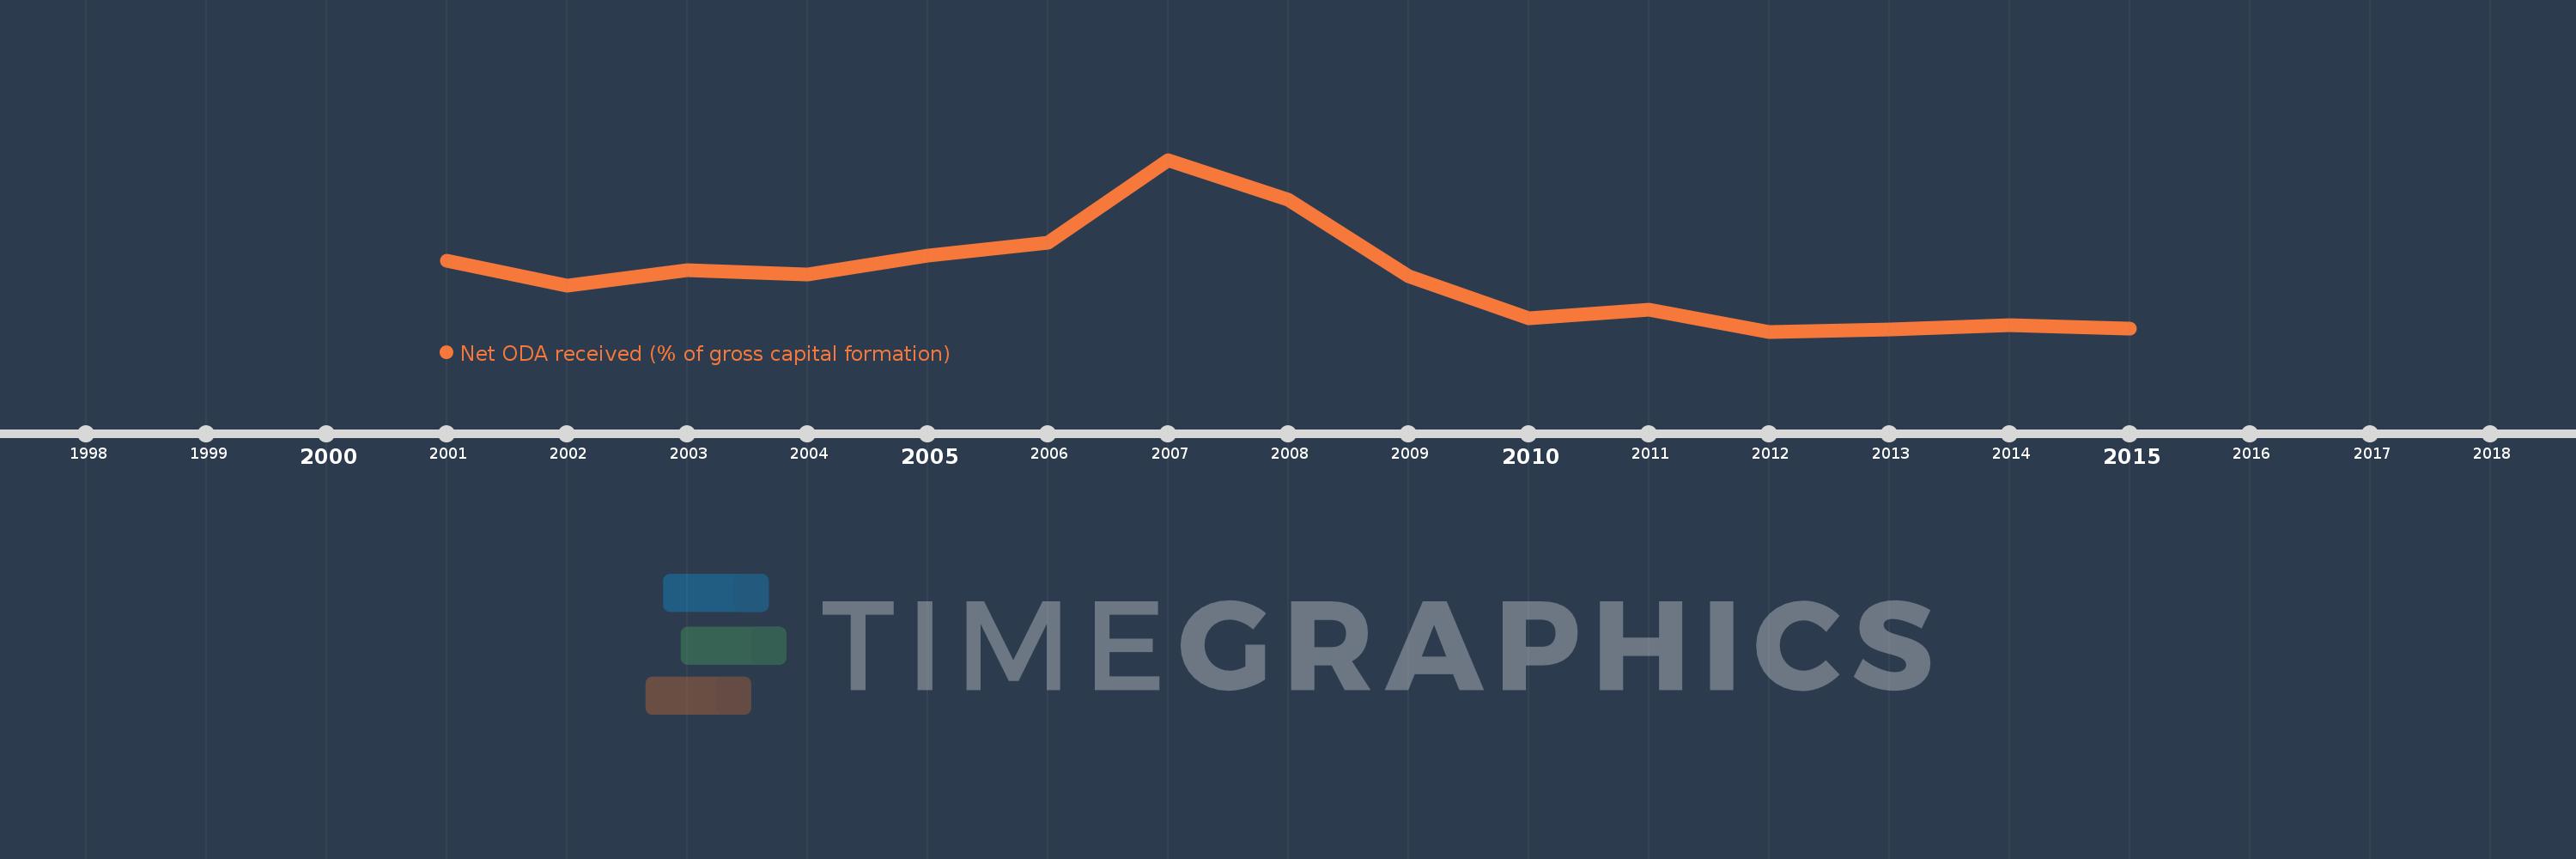
This timeline shows a graph from 2001 to 2015 of Timor-Leste. No data until 2000. Number of actual observations by date: 15.
Source name:
World Development Indicators
Source organization:
Development Assistance Committee of the Organisation for Economic Co-operation and Development, Geographical Distribution of Financial Flows to Developing Countries, Development Co-operation Report, and International Development Statistics database. Data are available online at: www.oecd.org/dac/stats/idsonline. World Bank gross capital formation estimates are used for the denominator.
Categories, topics:
Aid Effectiveness
Last updated:
apr 23, 2017
Indicators value changes by year
Meaning:
134.264
Minimum:
36.701
jan 1, 2012
Maximum:
348.45
jan 1, 2007
At the date of observation
Value
Absolute change
Change from the previous value
jan 1, 2001
165.193
+165.193
0.0%
jan 1, 2002
119.858
-45.335
-27.44%
jan 1, 2003
148.007
+28.149
23.49%
jan 1, 2004
140.024
-7.983
-5.39%
jan 1, 2005
175.261
+35.237
25.16%
jan 1, 2006
198.667
+23.406
13.35%
jan 1, 2007
348.45
+149.783
75.39%
jan 1, 2008
275.515
-72.935
-20.93%
jan 1, 2009
136.719
-138.796
-50.38%
jan 1, 2010
60.969
-75.75
-55.41%
jan 1, 2011
76.86
+15.891
26.06%
jan 1, 2012
36.701
-40.159
-52.25%
jan 1, 2013
40.904
+4.203
11.45%
jan 1, 2014
48.891
+7.987
19.53%
jan 1, 2015
41.937
-6.954
-14.22%
Ranking of countries by current statistics by years