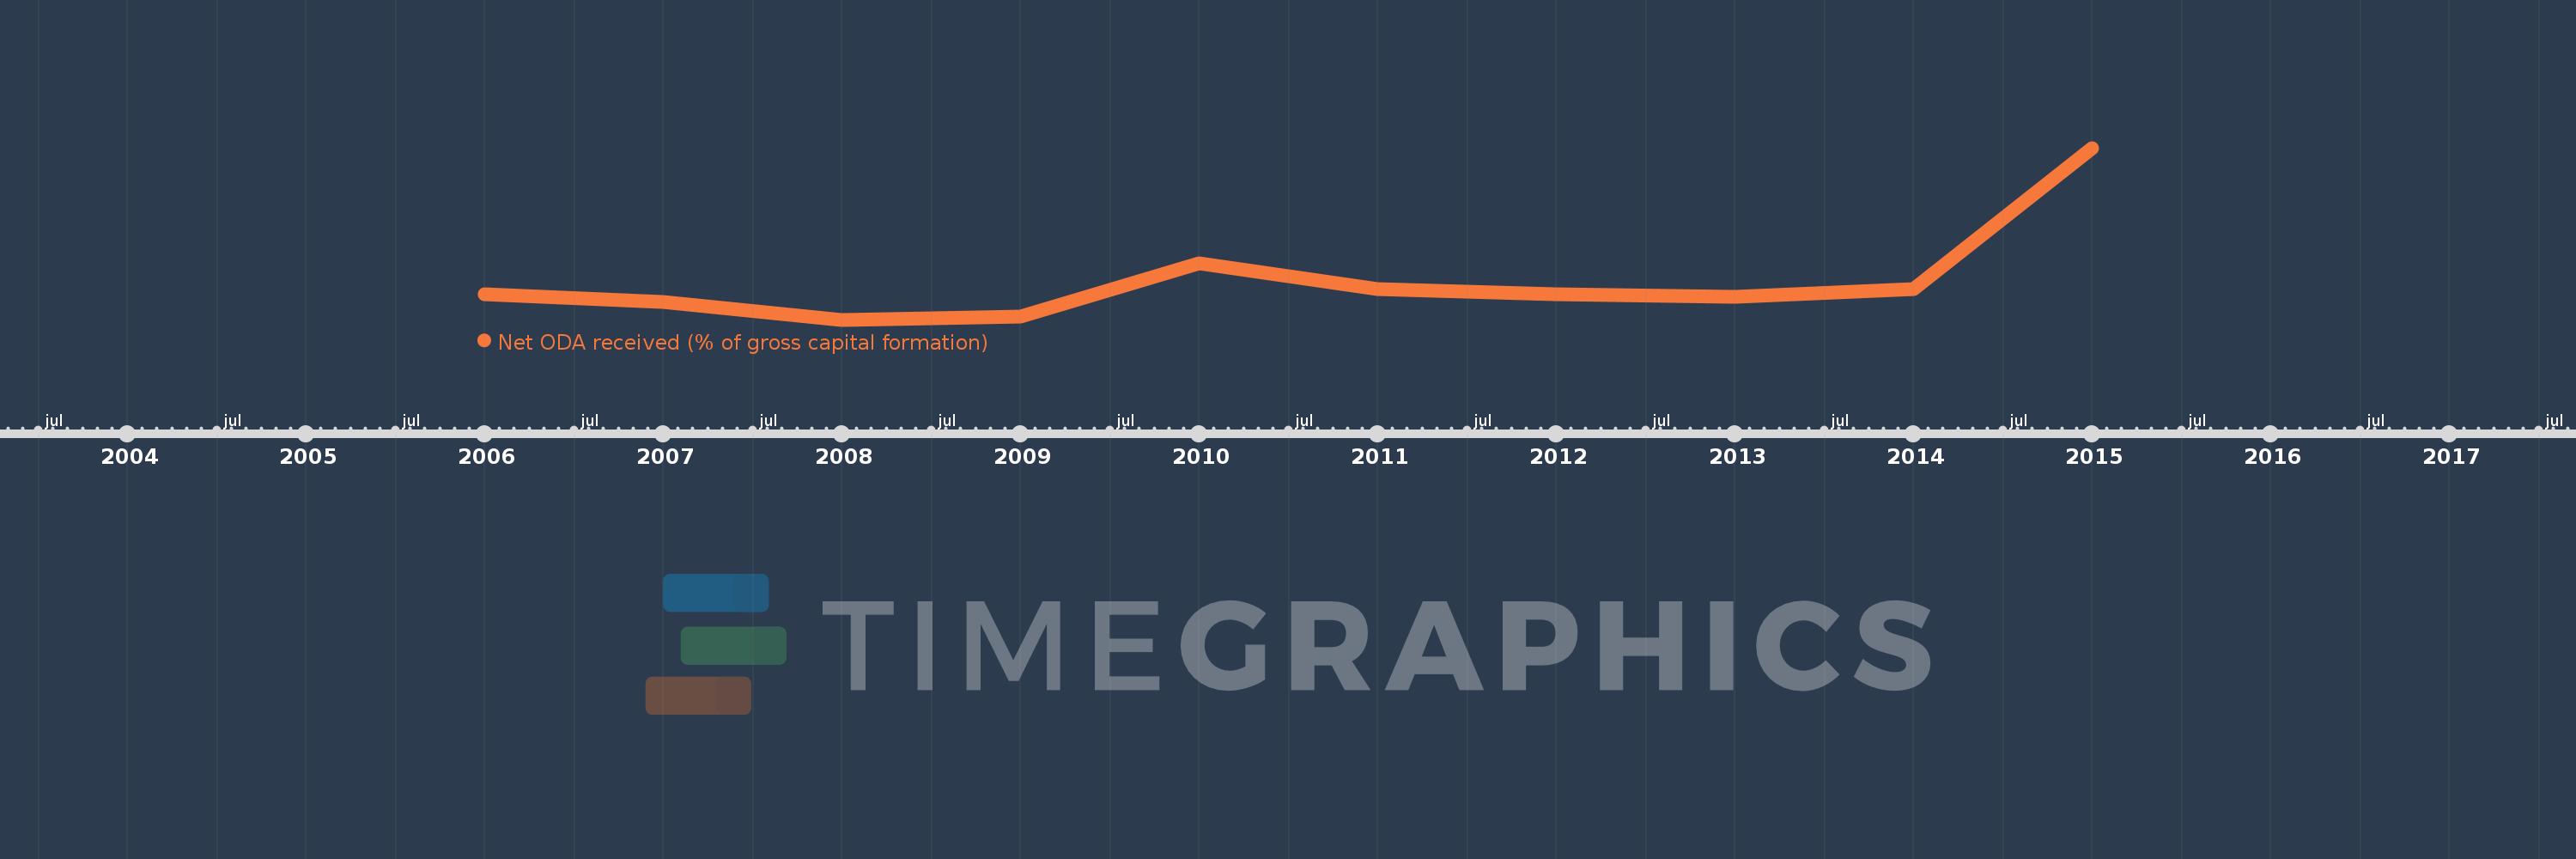
This timeline shows a graph from 2006 to 2015 of Ukraine. No data until 2005. Number of actual observations by date: 10.
Source name:
World Development Indicators
Source organization:
Development Assistance Committee of the Organisation for Economic Co-operation and Development, Geographical Distribution of Financial Flows to Developing Countries, Development Co-operation Report, and International Development Statistics database. Data are available online at: www.oecd.org/dac/stats/idsonline. World Bank gross capital formation estimates are used for the denominator.
Categories, topics:
Aid Effectiveness
Last updated:
apr 23, 2017
Indicators value changes by year
Meaning:
2.618
Minimum:
1.105
jan 1, 2008
Maximum:
7.848
jan 1, 2015
At the date of observation
Value
Absolute change
Change from the previous value
jan 1, 2006
2.116
+2.116
0.0%
jan 1, 2007
1.812
-0.304
-14.36%
jan 1, 2008
1.105
-0.707
-39.03%
jan 1, 2009
1.229
+0.124
11.22%
jan 1, 2010
3.331
+2.103
171.11%
jan 1, 2011
2.294
-1.037
-31.13%
jan 1, 2012
2.117
-0.177
-7.71%
jan 1, 2013
2.011
-0.107
-5.03%
jan 1, 2014
2.312
+0.301
14.96%
jan 1, 2015
7.848
+5.537
239.51%
Ranking of countries by current statistics by years