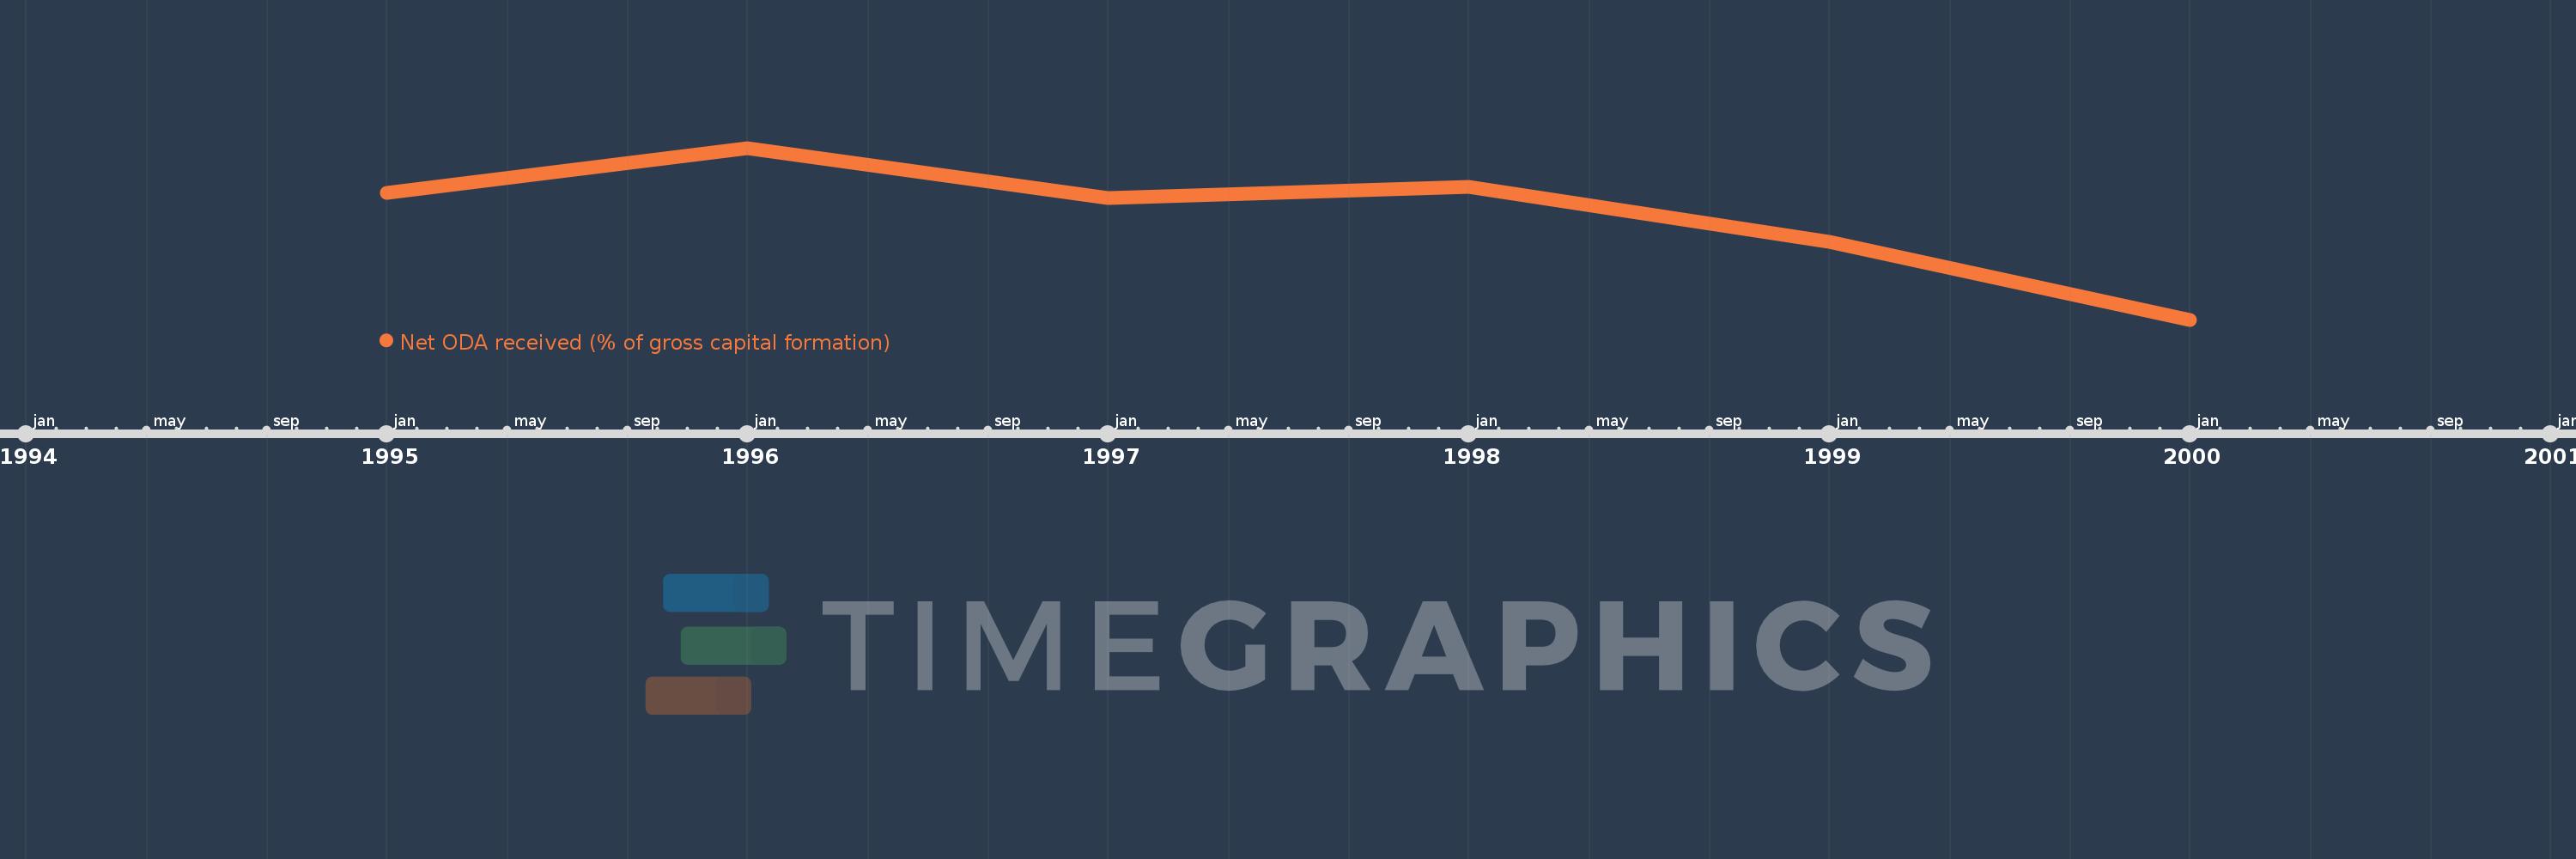
This timeline shows a graph from 1995 to 2000 of Aruba. No data until 1994. Number of actual observations by date: 6.
Source name:
World Development Indicators
Source organization:
Development Assistance Committee of the Organisation for Economic Co-operation and Development, Geographical Distribution of Financial Flows to Developing Countries, Development Co-operation Report, and International Development Statistics database. Data are available online at: www.oecd.org/dac/stats/idsonline. World Bank gross capital formation estimates are used for the denominator.
Categories, topics:
Aid Effectiveness
Last updated:
apr 23, 2017
Indicators value changes by year
Meaning:
3.424
Minimum:
-1.545
jan 1, 2000
Maximum:
6.569
jan 1, 1996
At the date of observation
Value
Absolute change
Change from the previous value
jan 1, 1995
4.441
+4.441
0.0%
jan 1, 1996
6.569
+2.128
47.92%
jan 1, 1997
4.212
-2.357
-35.88%
jan 1, 1998
4.749
+0.537
12.75%
jan 1, 1999
2.117
-2.632
-55.43%
jan 1, 2000
-1.545
-3.662
-173.0%
Ranking of countries by current statistics by years