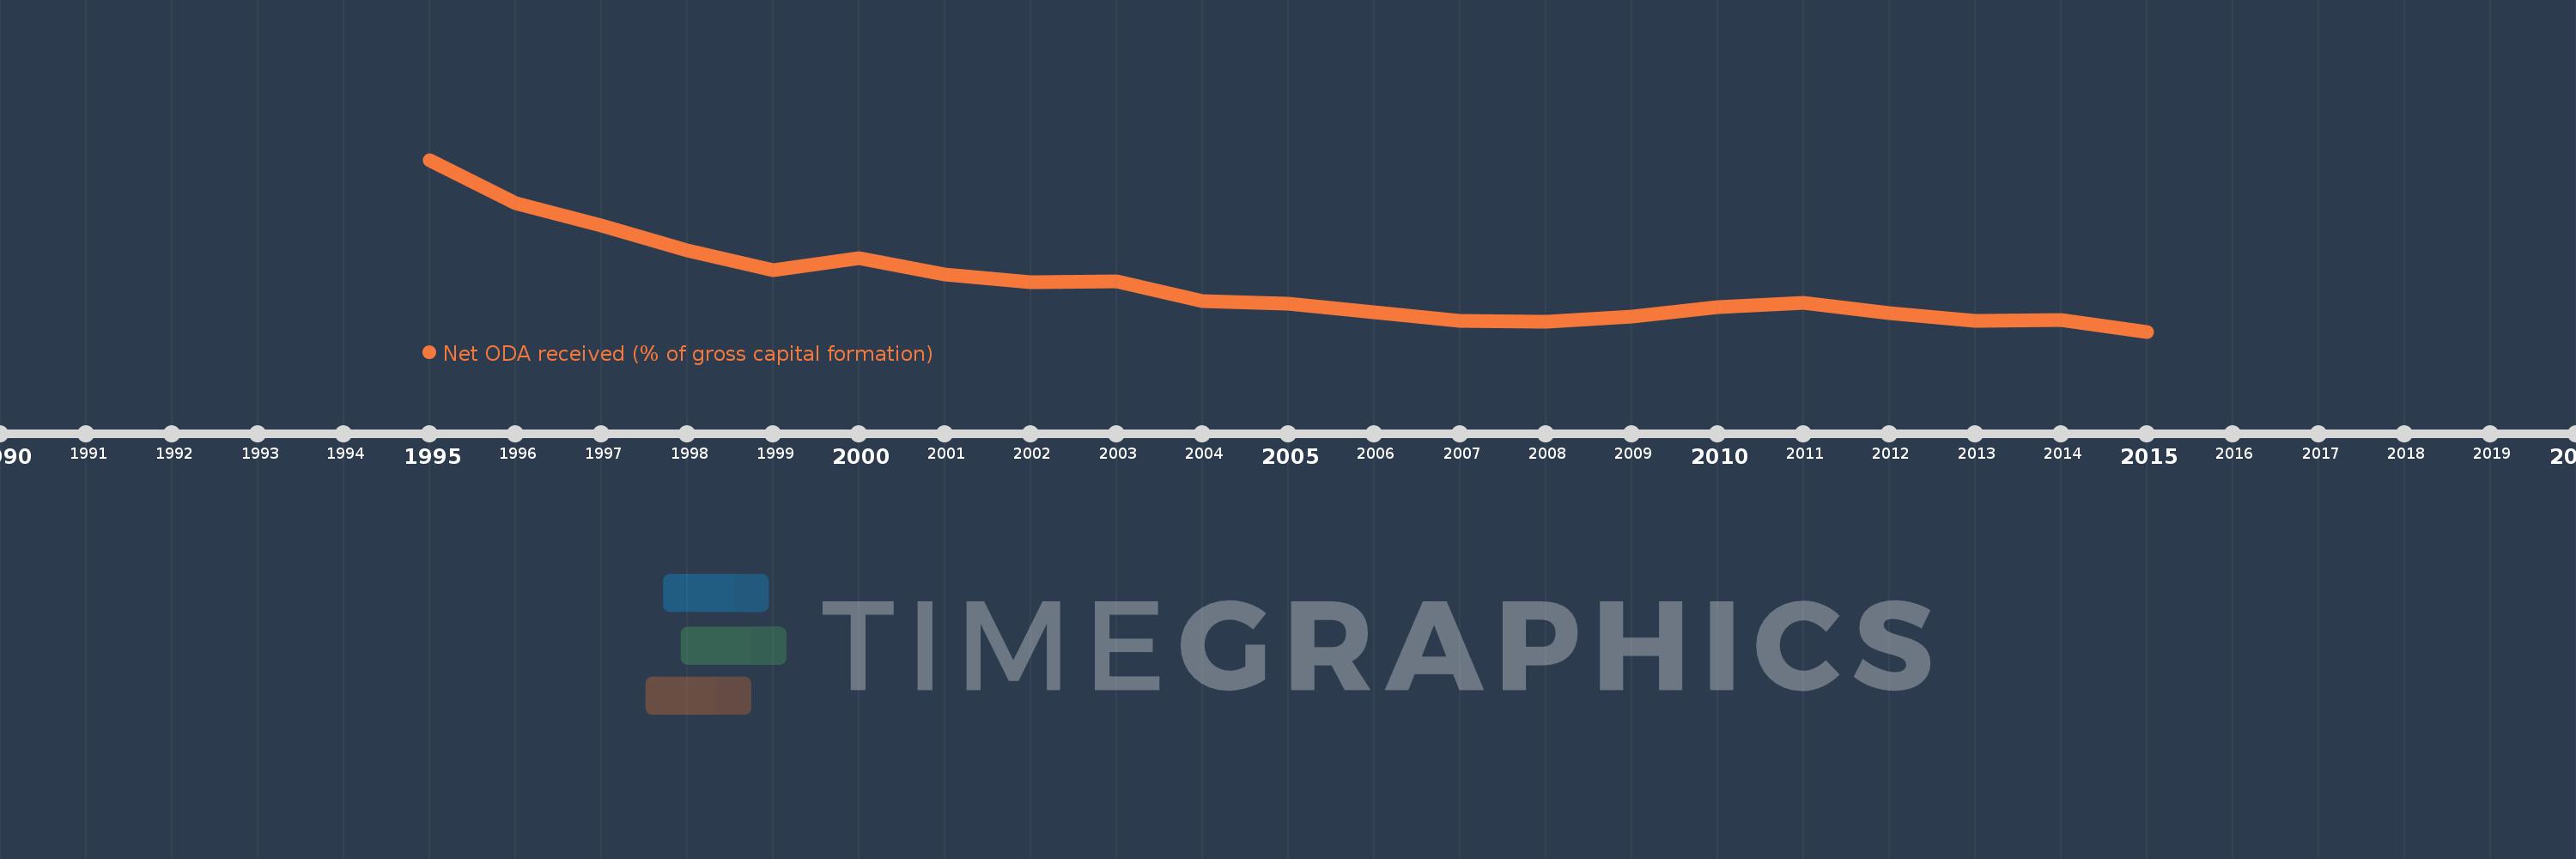
This timeline shows a graph from 1995 to 2015 of Small states. No data until 1994. Number of actual observations by date: 21.
Source name:
World Development Indicators
Source organization:
Development Assistance Committee of the Organisation for Economic Co-operation and Development, Geographical Distribution of Financial Flows to Developing Countries, Development Co-operation Report, and International Development Statistics database. Data are available online at: www.oecd.org/dac/stats/idsonline. World Bank gross capital formation estimates are used for the denominator.
Categories, topics:
Aid Effectiveness
Last updated:
apr 23, 2017
Indicators value changes by year
Meaning:
4.913
Minimum:
2.244
jan 1, 2015
Maximum:
11.99
jan 1, 1995
At the date of observation
Value
Absolute change
Change from the previous value
jan 1, 1995
11.99
+11.99
0.0%
jan 1, 1996
9.551
-2.44
-20.35%
jan 1, 1997
8.252
-1.299
-13.6%
jan 1, 1998
6.859
-1.393
-16.88%
jan 1, 1999
5.743
-1.116
-16.27%
jan 1, 2000
6.405
+0.663
11.54%
jan 1, 2001
5.504
-0.901
-14.07%
jan 1, 2002
5.033
-0.471
-8.57%
jan 1, 2003
5.11
+0.078
1.55%
jan 1, 2004
3.954
-1.156
-22.63%
jan 1, 2005
3.817
-0.137
-3.47%
jan 1, 2006
3.363
-0.454
-11.89%
jan 1, 2007
2.872
-0.491
-14.61%
jan 1, 2008
2.825
-0.047
-1.62%
jan 1, 2009
3.106
+0.281
9.96%
jan 1, 2010
3.624
+0.517
16.65%
jan 1, 2011
3.875
+0.251
6.93%
jan 1, 2012
3.281
-0.593
-15.31%
jan 1, 2013
2.873
-0.408
-12.44%
jan 1, 2014
2.887
+0.013
0.47%
jan 1, 2015
2.244
-0.643
-22.26%
Ranking of countries by current statistics by years