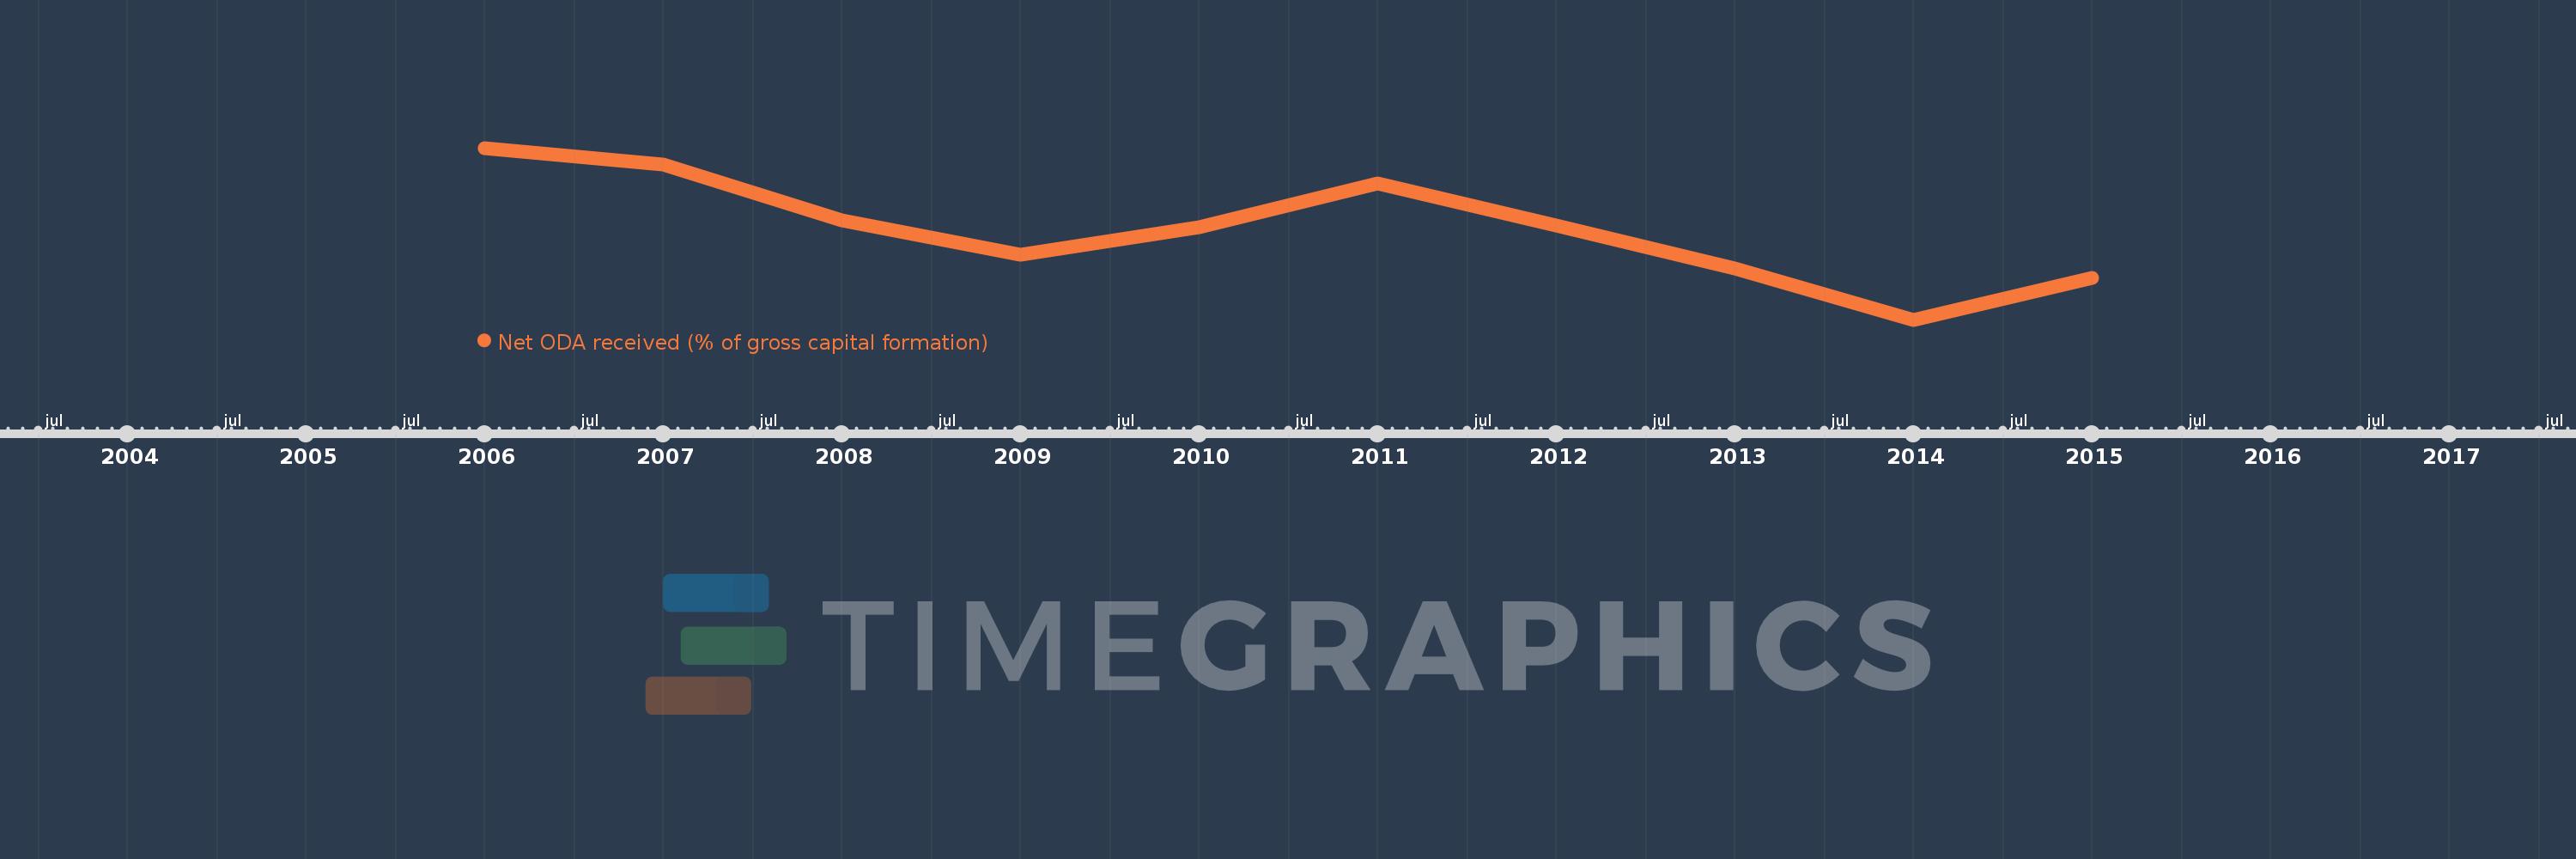
This timeline shows a graph from 2006 to 2015 of Belarus. No data until 2005. Number of actual observations by date: 10.
Source name:
World Development Indicators
Source organization:
Development Assistance Committee of the Organisation for Economic Co-operation and Development, Geographical Distribution of Financial Flows to Developing Countries, Development Co-operation Report, and International Development Statistics database. Data are available online at: www.oecd.org/dac/stats/idsonline. World Bank gross capital formation estimates are used for the denominator.
Categories, topics:
Aid Effectiveness
Last updated:
apr 23, 2017
Indicators value changes by year
Meaning:
0.529
Minimum:
0.367
jan 1, 2014
Maximum:
0.672
jan 1, 2006
At the date of observation
Value
Absolute change
Change from the previous value
jan 1, 2006
0.672
+0.672
0.0%
jan 1, 2007
0.643
-0.029
-4.33%
jan 1, 2008
0.543
-0.101
-15.64%
jan 1, 2009
0.483
-0.06
-11.02%
jan 1, 2010
0.532
+0.05
10.27%
jan 1, 2011
0.609
+0.077
14.4%
jan 1, 2012
0.535
-0.074
-12.16%
jan 1, 2013
0.458
-0.077
-14.39%
jan 1, 2014
0.367
-0.091
-19.79%
jan 1, 2015
0.442
+0.075
20.31%
Ranking of countries by current statistics by years