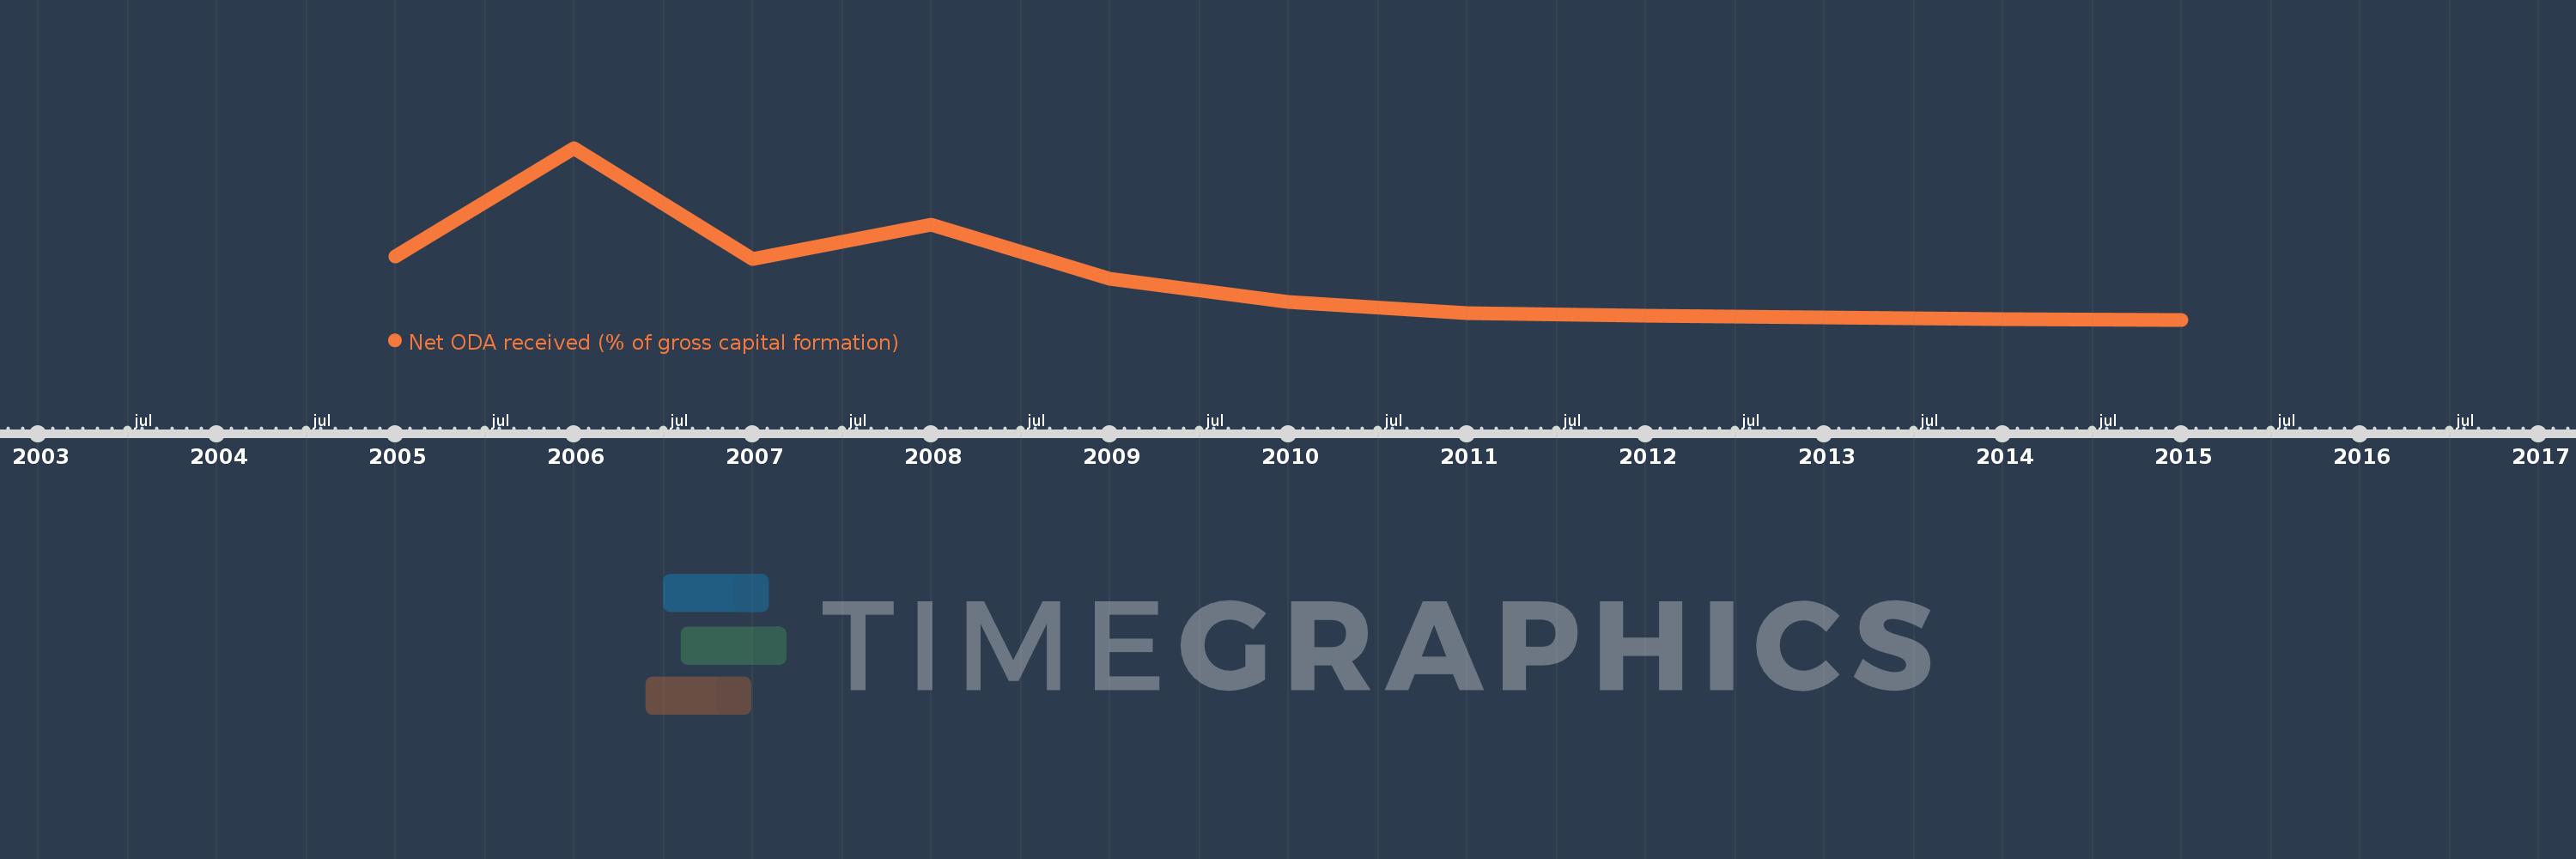
This timeline shows a graph from 2005 to 2015 of Iraq. No data until 2004. Number of actual observations by date: 11.
Source name:
World Development Indicators
Source organization:
Development Assistance Committee of the Organisation for Economic Co-operation and Development, Geographical Distribution of Financial Flows to Developing Countries, Development Co-operation Report, and International Development Statistics database. Data are available online at: www.oecd.org/dac/stats/idsonline. World Bank gross capital formation estimates are used for the denominator.
Categories, topics:
Aid Effectiveness
Last updated:
apr 23, 2017
Indicators value changes by year
Meaning:
50.379
Minimum:
1.951
jan 1, 2015
Maximum:
199.294
jan 1, 2006
At the date of observation
Value
Absolute change
Change from the previous value
jan 1, 2005
75.055
+75.055
0.0%
jan 1, 2006
199.294
+124.238
165.53%
jan 1, 2007
72.136
-127.157
-63.8%
jan 1, 2008
110.907
+38.77
53.75%
jan 1, 2009
49.461
-61.445
-55.4%
jan 1, 2010
22.127
-27.334
-55.26%
jan 1, 2011
9.911
-12.216
-55.21%
jan 1, 2012
6.668
-3.242
-32.71%
jan 1, 2013
4.438
-2.231
-33.45%
jan 1, 2014
2.225
-2.212
-49.85%
jan 1, 2015
1.951
-0.274
-12.32%
Ranking of countries by current statistics by years