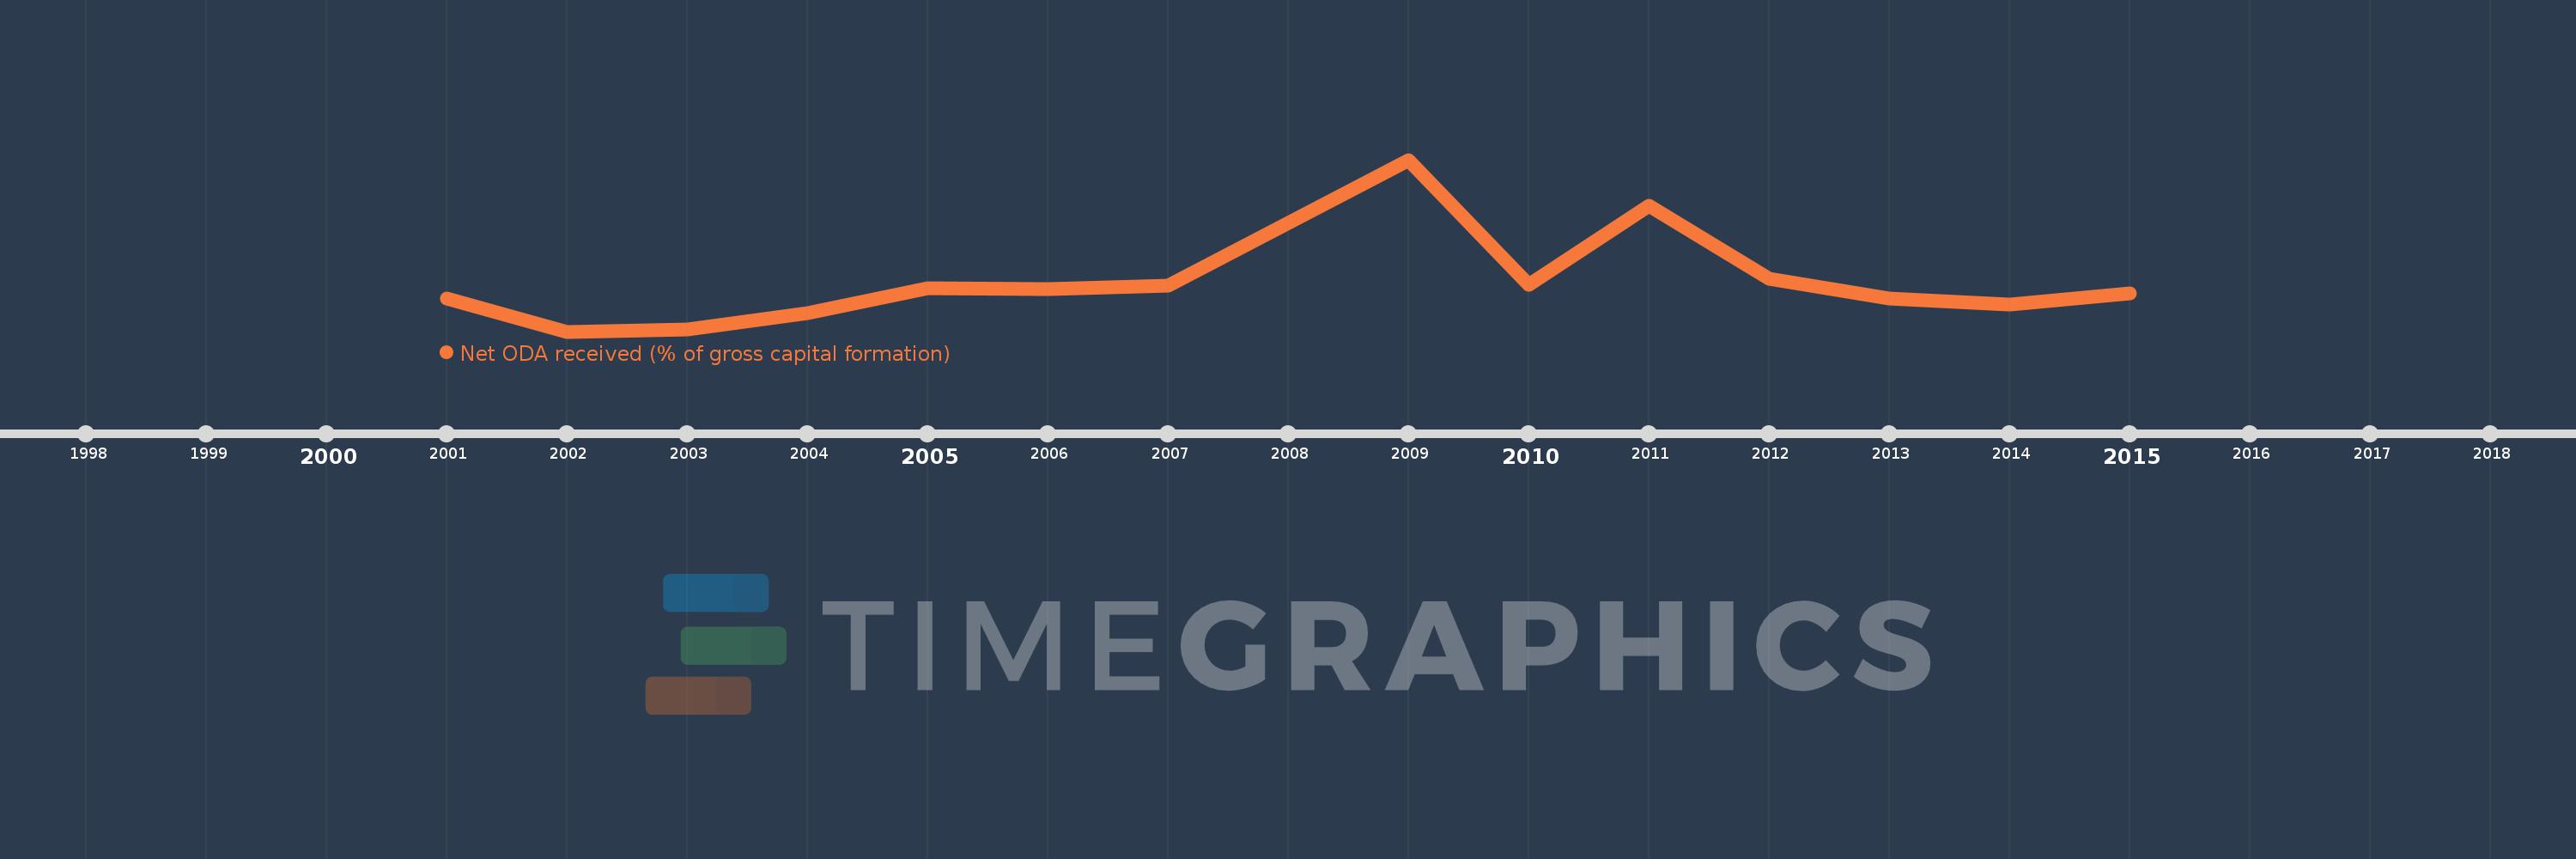
This timeline shows a graph from 2001 to 2015 of Liberia. No data until 2000. Number of actual observations by date: 15.
Source name:
World Development Indicators
Source organization:
Development Assistance Committee of the Organisation for Economic Co-operation and Development, Geographical Distribution of Financial Flows to Developing Countries, Development Co-operation Report, and International Development Statistics database. Data are available online at: www.oecd.org/dac/stats/idsonline. World Bank gross capital formation estimates are used for the denominator.
Categories, topics:
Aid Effectiveness
Last updated:
apr 23, 2017
Indicators value changes by year
Meaning:
251.448
Minimum:
28.294
jan 1, 2002
Maximum:
756.473
jan 1, 2009
At the date of observation
Value
Absolute change
Change from the previous value
jan 1, 2001
169.91
+169.91
0.0%
jan 1, 2002
28.294
-141.616
-83.35%
jan 1, 2003
38.916
+10.621
37.54%
jan 1, 2004
108.02
+69.105
177.58%
jan 1, 2005
211.139
+103.118
95.46%
jan 1, 2006
207.935
-3.204
-1.52%
jan 1, 2007
221.639
+13.704
6.59%
jan 1, 2008
487.841
+266.202
120.11%
jan 1, 2009
756.473
+268.632
55.07%
jan 1, 2010
228.084
-528.389
-69.85%
jan 1, 2011
561.772
+333.688
146.3%
jan 1, 2012
253.118
-308.654
-54.94%
jan 1, 2013
167.599
-85.519
-33.79%
jan 1, 2014
141.3
-26.298
-15.69%
jan 1, 2015
189.687
+48.387
34.24%
Ranking of countries by current statistics by years