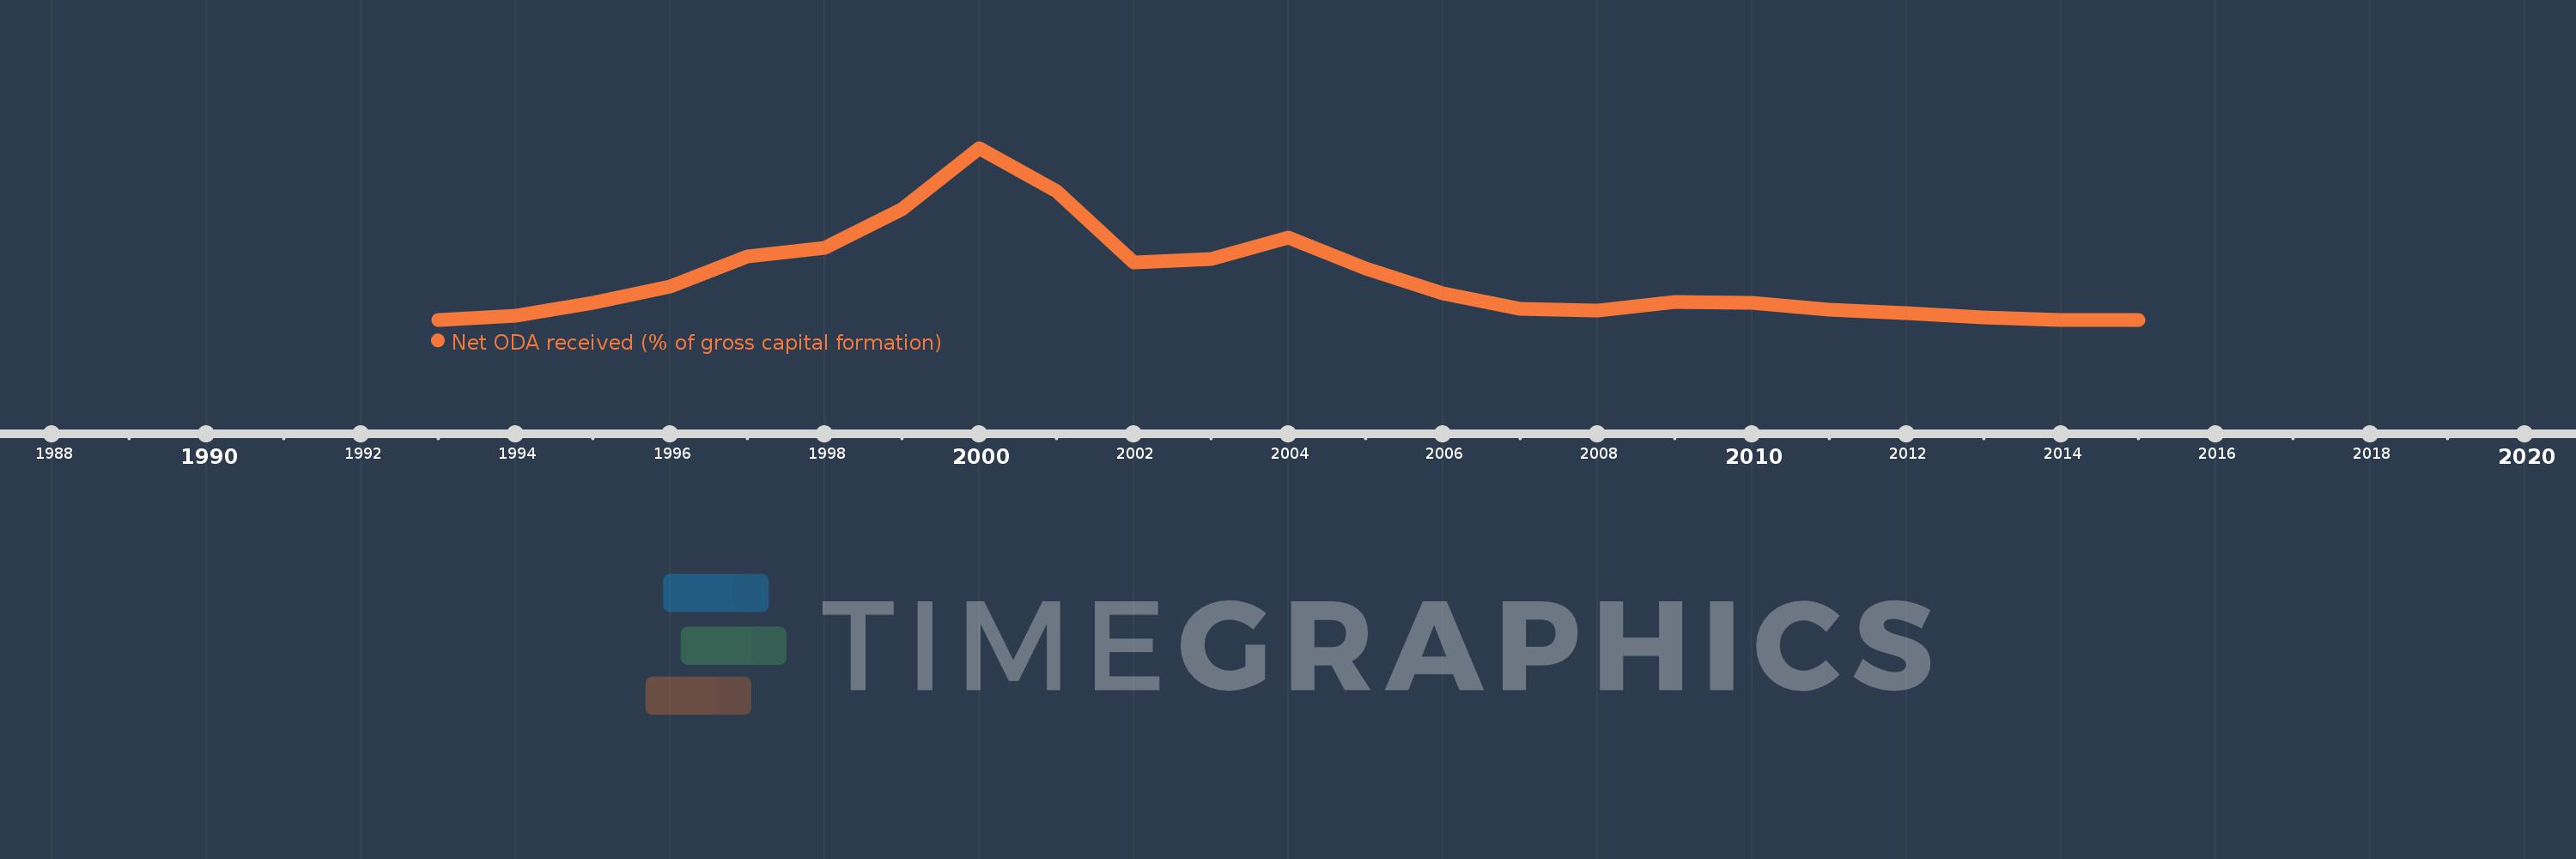
This timeline shows a graph from 1993 to 2015 of Kazakhstan. No data until 1992. Number of actual observations by date: 23.
Source name:
World Development Indicators
Source organization:
Development Assistance Committee of the Organisation for Economic Co-operation and Development, Geographical Distribution of Financial Flows to Developing Countries, Development Co-operation Report, and International Development Statistics database. Data are available online at: www.oecd.org/dac/stats/idsonline. World Bank gross capital formation estimates are used for the denominator.
Categories, topics:
Aid Effectiveness
Last updated:
apr 23, 2017
Indicators value changes by year
Meaning:
1.942
Minimum:
0.152
jan 1, 2014
Maximum:
7.568
jan 1, 2000
At the date of observation
Value
Absolute change
Change from the previous value
jan 1, 1993
0.154
+0.154
0.0%
jan 1, 1994
0.327
+0.174
112.91%
jan 1, 1995
0.873
+0.546
166.69%
jan 1, 1996
1.6
+0.727
83.2%
jan 1, 1997
2.882
+1.282
80.16%
jan 1, 1998
3.244
+0.362
12.55%
jan 1, 1999
4.929
+1.685
51.95%
jan 1, 2000
7.568
+2.639
53.53%
jan 1, 2001
5.702
-1.866
-24.66%
jan 1, 2002
2.637
-3.065
-53.75%
jan 1, 2003
2.788
+0.151
5.72%
jan 1, 2004
3.708
+0.92
33.0%
jan 1, 2005
2.358
-1.349
-36.39%
jan 1, 2006
1.294
-1.065
-45.14%
jan 1, 2007
0.635
-0.659
-50.94%
jan 1, 2008
0.566
-0.069
-10.83%
jan 1, 2009
0.914
+0.348
61.46%
jan 1, 2010
0.877
-0.037
-4.01%
jan 1, 2011
0.603
-0.275
-31.3%
jan 1, 2012
0.455
-0.148
-24.55%
jan 1, 2013
0.245
-0.21
-46.08%
jan 1, 2014
0.152
-0.093
-38.12%
jan 1, 2015
0.155
+0.003
2.07%
Ranking of countries by current statistics by years