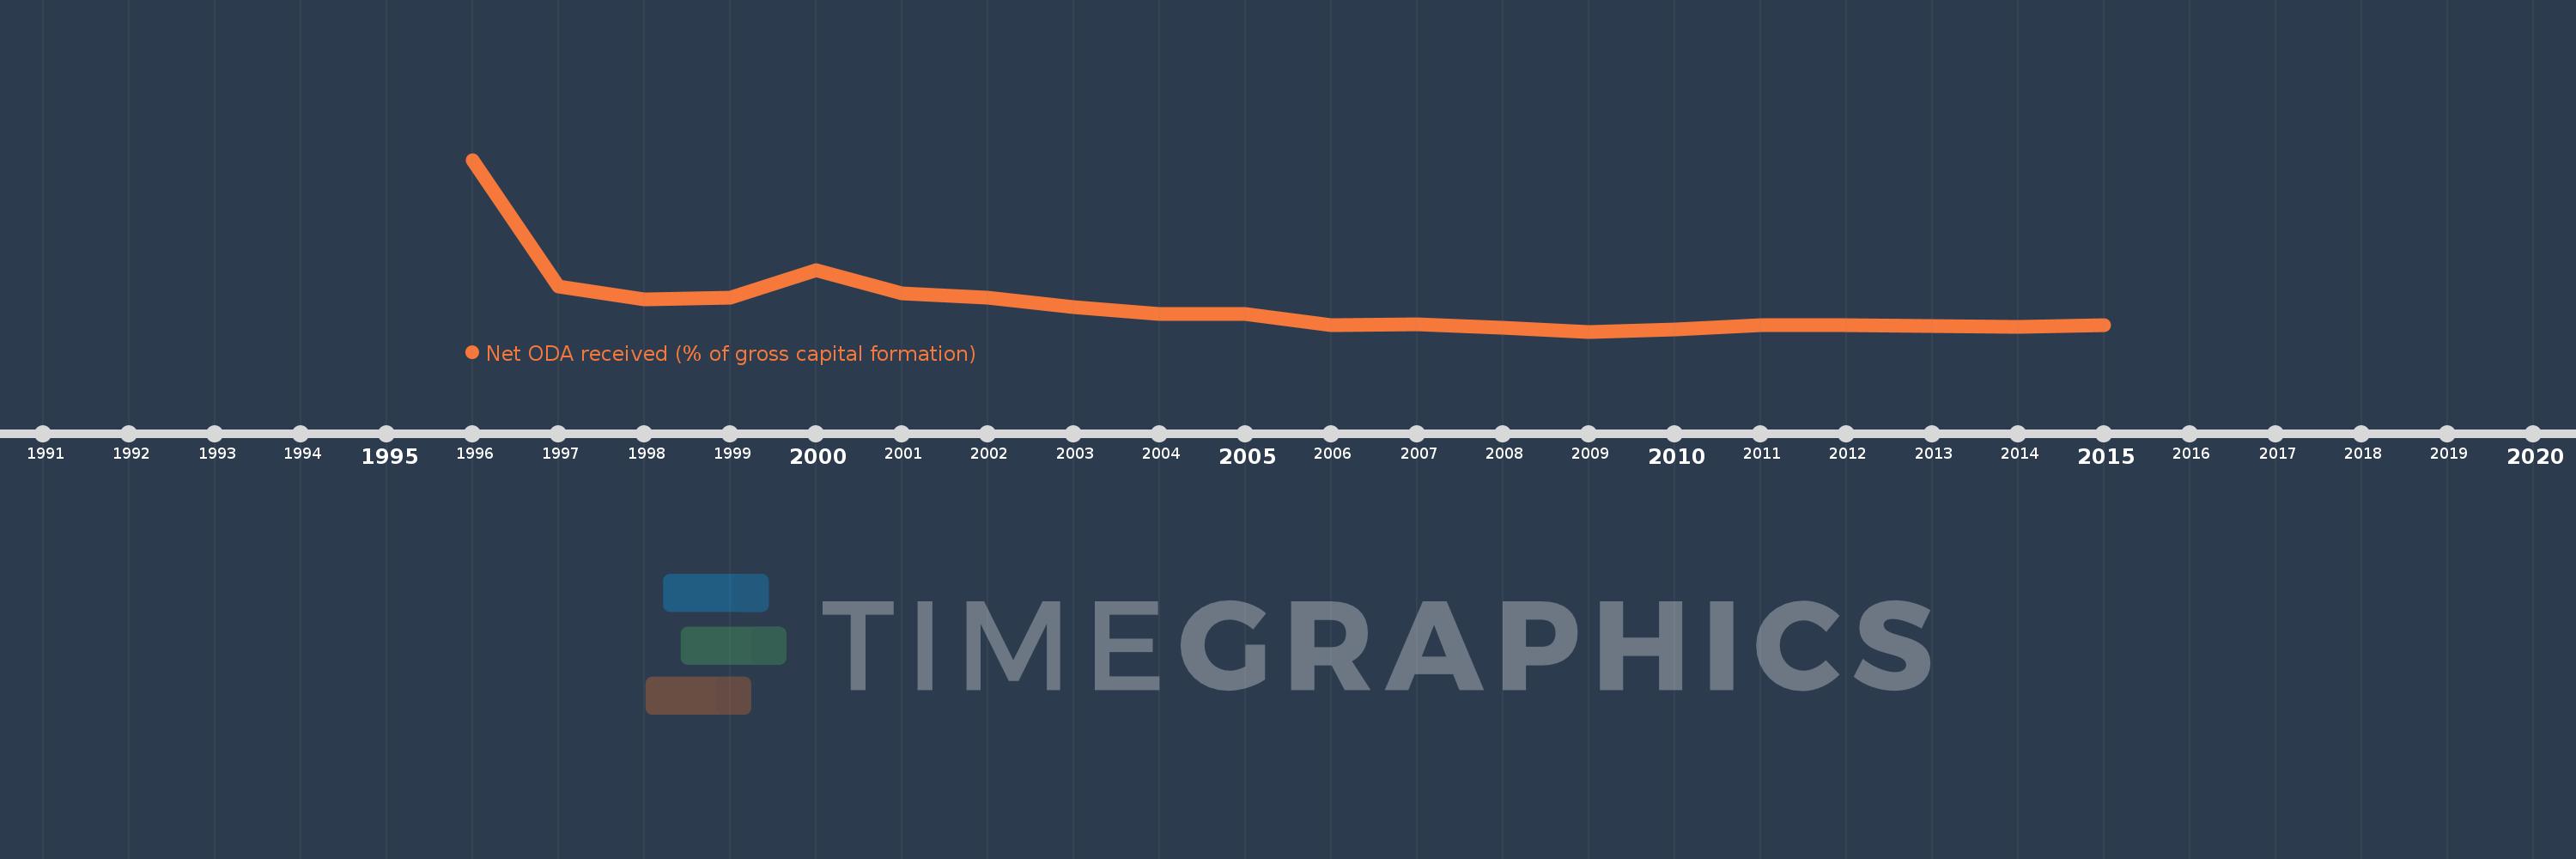
This timeline shows a graph from 1996 to 2015 of Bosnia and Herzegovina. No data until 1995. Number of actual observations by date: 20.
Source name:
World Development Indicators
Source organization:
Development Assistance Committee of the Organisation for Economic Co-operation and Development, Geographical Distribution of Financial Flows to Developing Countries, Development Co-operation Report, and International Development Statistics database. Data are available online at: www.oecd.org/dac/stats/idsonline. World Bank gross capital formation estimates are used for the denominator.
Categories, topics:
Aid Effectiveness
Last updated:
apr 23, 2017
Indicators value changes by year
Meaning:
47.326
Minimum:
9.172
jan 1, 2009
Maximum:
258.928
jan 1, 1996
At the date of observation
Value
Absolute change
Change from the previous value
jan 1, 1996
258.928
+258.928
0.0%
jan 1, 1997
74.184
-184.744
-71.35%
jan 1, 1998
55.899
-18.285
-24.65%
jan 1, 1999
58.489
+2.59
4.63%
jan 1, 2000
98.036
+39.547
67.61%
jan 1, 2001
65.214
-32.822
-33.48%
jan 1, 2002
58.361
-6.853
-10.51%
jan 1, 2003
45.022
-13.339
-22.86%
jan 1, 2004
34.358
-10.664
-23.69%
jan 1, 2005
35.292
+0.934
2.72%
jan 1, 2006
17.963
-17.328
-49.1%
jan 1, 2007
19.221
+1.257
7.0%
jan 1, 2008
14.978
-4.243
-22.07%
jan 1, 2009
9.172
-5.806
-38.77%
jan 1, 2010
12.162
+2.991
32.61%
jan 1, 2011
18.609
+6.447
53.01%
jan 1, 2012
18.333
-0.276
-1.49%
jan 1, 2013
17.617
-0.716
-3.9%
jan 1, 2014
16.127
-1.49
-8.46%
jan 1, 2015
18.558
+2.431
15.07%
Ranking of countries by current statistics by years