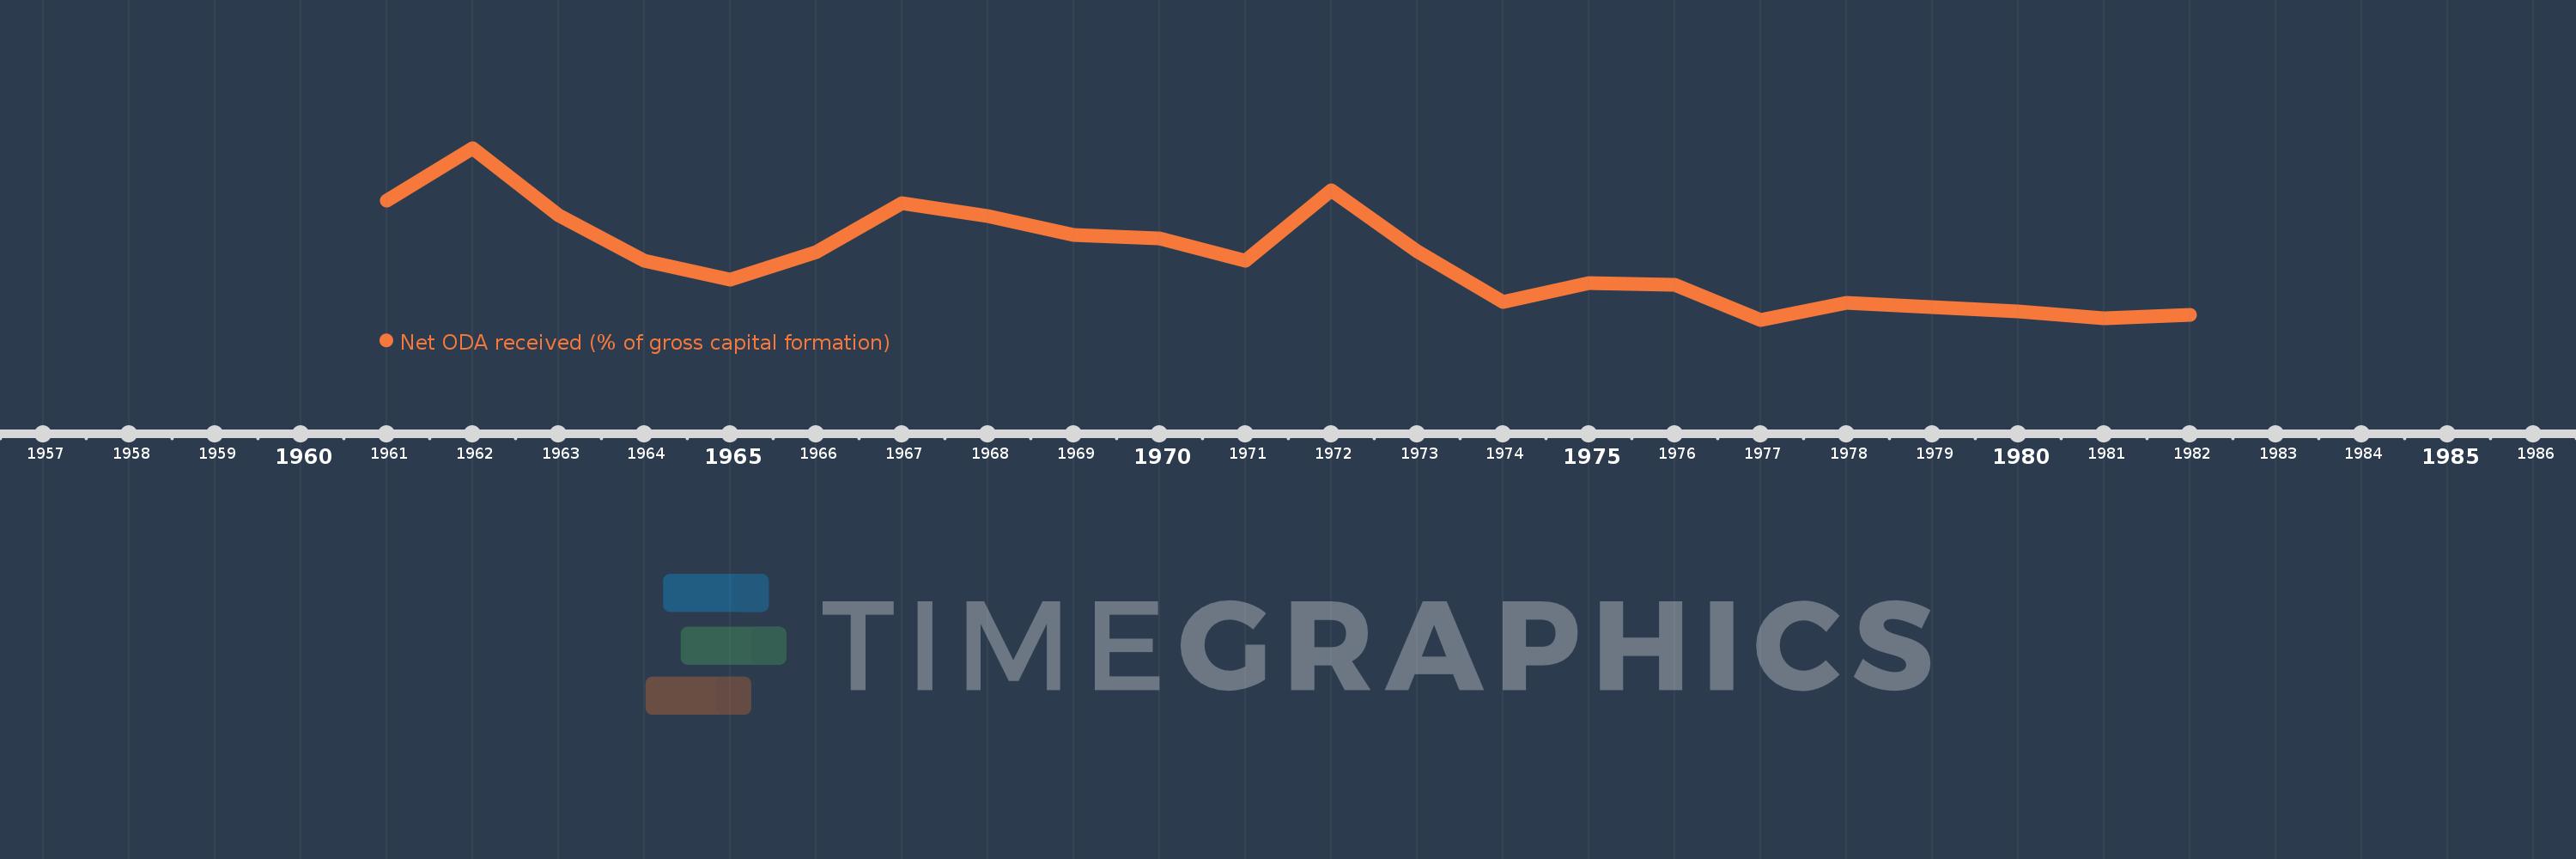
This timeline shows a graph from 1961 to 1982 of Lesotho. No data until 1960. Number of actual observations by date: 22.
Source name:
World Development Indicators
Source organization:
Development Assistance Committee of the Organisation for Economic Co-operation and Development, Geographical Distribution of Financial Flows to Developing Countries, Development Co-operation Report, and International Development Statistics database. Data are available online at: www.oecd.org/dac/stats/idsonline. World Bank gross capital formation estimates are used for the denominator.
Categories, topics:
Aid Effectiveness
Last updated:
apr 23, 2017
Indicators value changes by year
Meaning:
141.229
Minimum:
56.366
jan 1, 1977
Maximum:
295.72
jan 1, 1962
At the date of observation
Value
Absolute change
Change from the previous value
jan 1, 1961
222.862
+222.862
0.0%
jan 1, 1962
295.72
+72.859
32.69%
jan 1, 1963
201.705
-94.015
-31.79%
jan 1, 1964
138.919
-62.786
-31.13%
jan 1, 1965
112.304
-26.615
-19.16%
jan 1, 1966
150.638
+38.334
34.13%
jan 1, 1967
218.471
+67.833
45.03%
jan 1, 1968
200.879
-17.593
-8.05%
jan 1, 1969
174.342
-26.537
-13.21%
jan 1, 1970
169.744
-4.598
-2.64%
jan 1, 1971
139.003
-30.741
-18.11%
jan 1, 1972
237.017
+98.014
70.51%
jan 1, 1973
151.983
-85.034
-35.88%
jan 1, 1974
80.562
-71.421
-46.99%
jan 1, 1975
107.779
+27.217
33.78%
jan 1, 1976
105.305
-2.474
-2.3%
jan 1, 1977
56.366
-48.939
-46.47%
jan 1, 1978
79.721
+23.355
41.43%
jan 1, 1979
74.081
-5.64
-7.07%
jan 1, 1980
68.107
-5.974
-8.06%
jan 1, 1981
58.275
-9.832
-14.44%
jan 1, 1982
63.246
+4.971
8.53%
Ranking of countries by current statistics by years