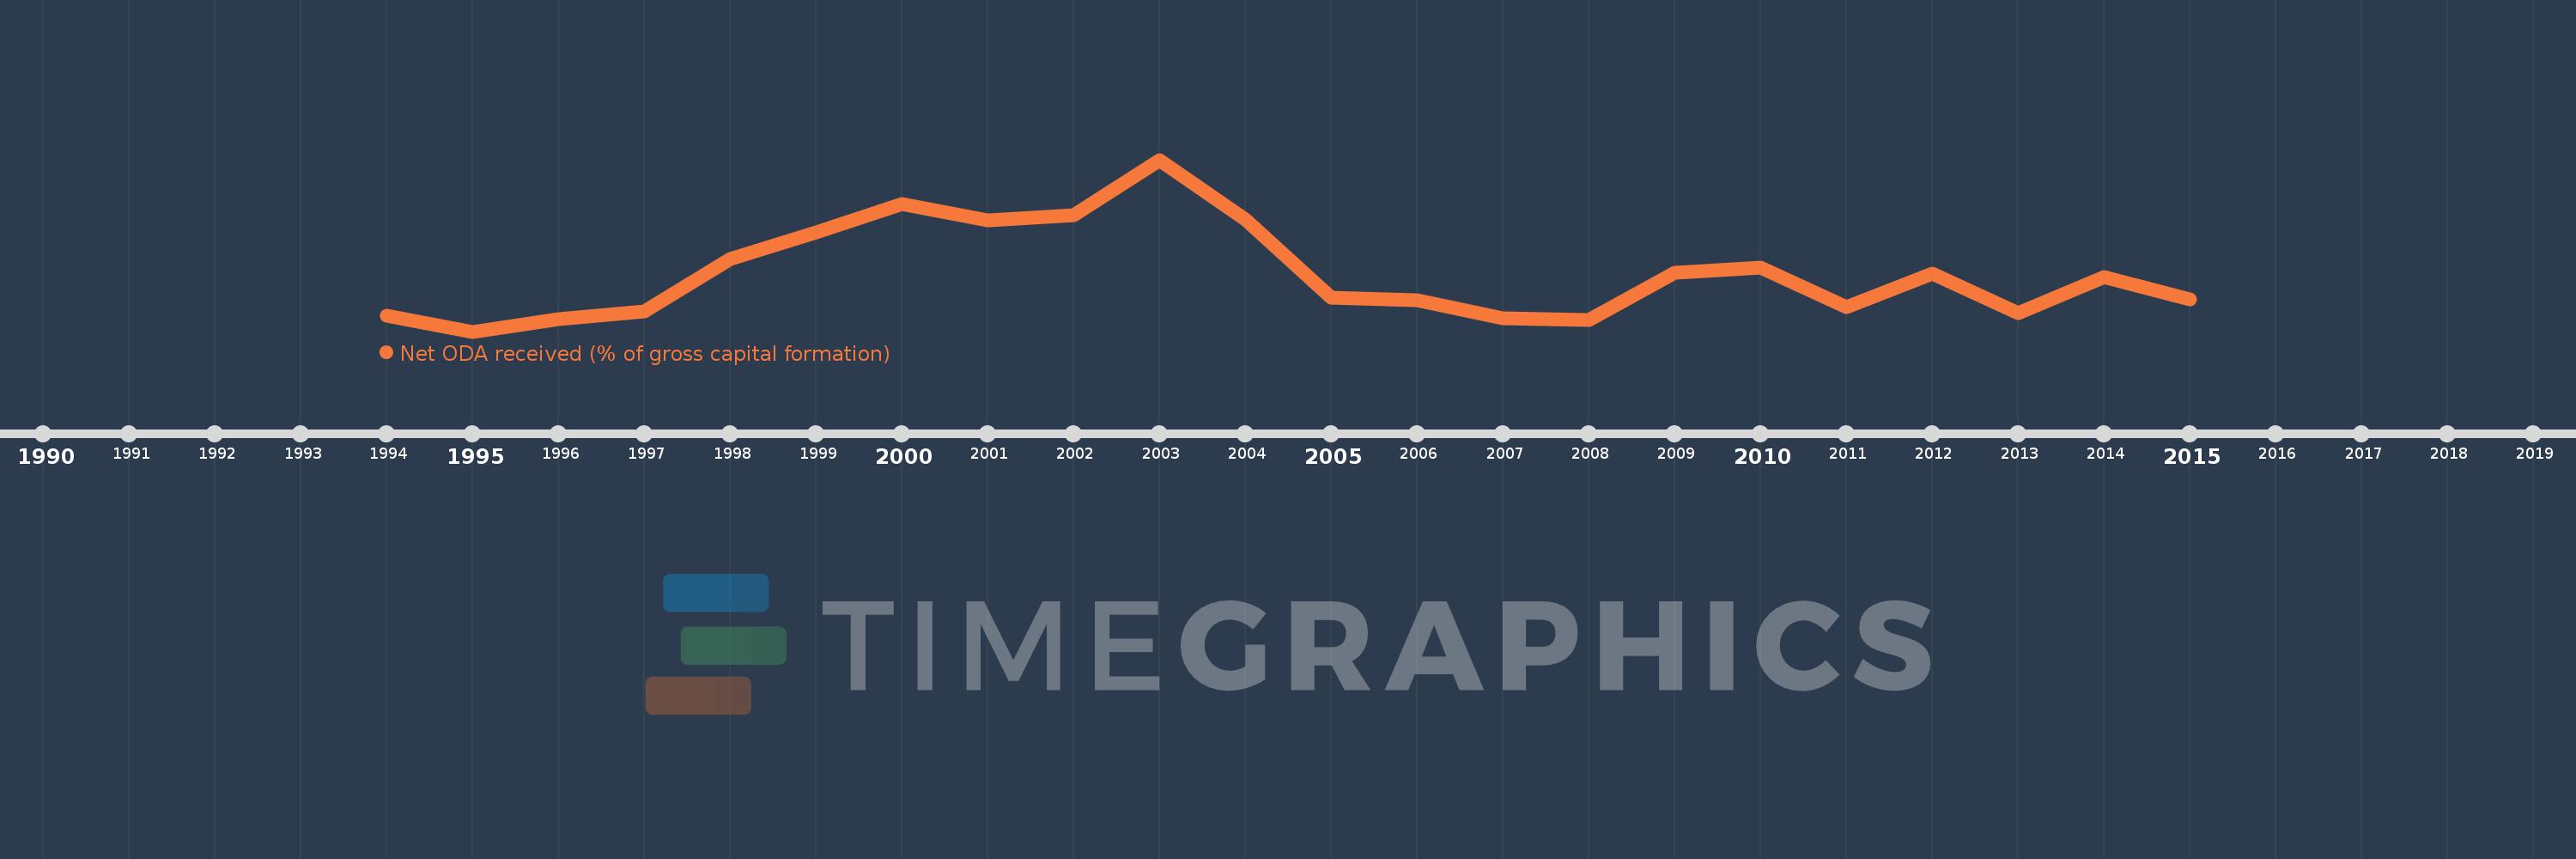
This timeline shows a graph from 1994 to 2015 of South Africa. No data until 1993. Number of actual observations by date: 22.
Source name:
World Development Indicators
Source organization:
Development Assistance Committee of the Organisation for Economic Co-operation and Development, Geographical Distribution of Financial Flows to Developing Countries, Development Co-operation Report, and International Development Statistics database. Data are available online at: www.oecd.org/dac/stats/idsonline. World Bank gross capital formation estimates are used for the denominator.
Categories, topics:
Aid Effectiveness
Last updated:
apr 23, 2017
Indicators value changes by year
Meaning:
1.695
Minimum:
1.183
jan 1, 1995
Maximum:
2.72
jan 1, 2003
At the date of observation
Value
Absolute change
Change from the previous value
jan 1, 1994
1.328
+1.328
0.0%
jan 1, 1995
1.183
-0.145
-10.89%
jan 1, 1996
1.296
+0.113
9.51%
jan 1, 1997
1.361
+0.065
4.99%
jan 1, 1998
1.833
+0.473
34.74%
jan 1, 1999
2.069
+0.236
12.88%
jan 1, 2000
2.322
+0.252
12.2%
jan 1, 2001
2.179
-0.142
-6.14%
jan 1, 2002
2.223
+0.044
2.01%
jan 1, 2003
2.72
+0.496
22.33%
jan 1, 2004
2.187
-0.533
-19.58%
jan 1, 2005
1.49
-0.697
-31.86%
jan 1, 2006
1.462
-0.028
-1.9%
jan 1, 2007
1.304
-0.158
-10.83%
jan 1, 2008
1.285
-0.019
-1.46%
jan 1, 2009
1.706
+0.421
32.77%
jan 1, 2010
1.752
+0.046
2.72%
jan 1, 2011
1.402
-0.35
-19.99%
jan 1, 2012
1.699
+0.297
21.21%
jan 1, 2013
1.347
-0.352
-20.72%
jan 1, 2014
1.674
+0.327
24.3%
jan 1, 2015
1.469
-0.206
-12.29%
Ranking of countries by current statistics by years