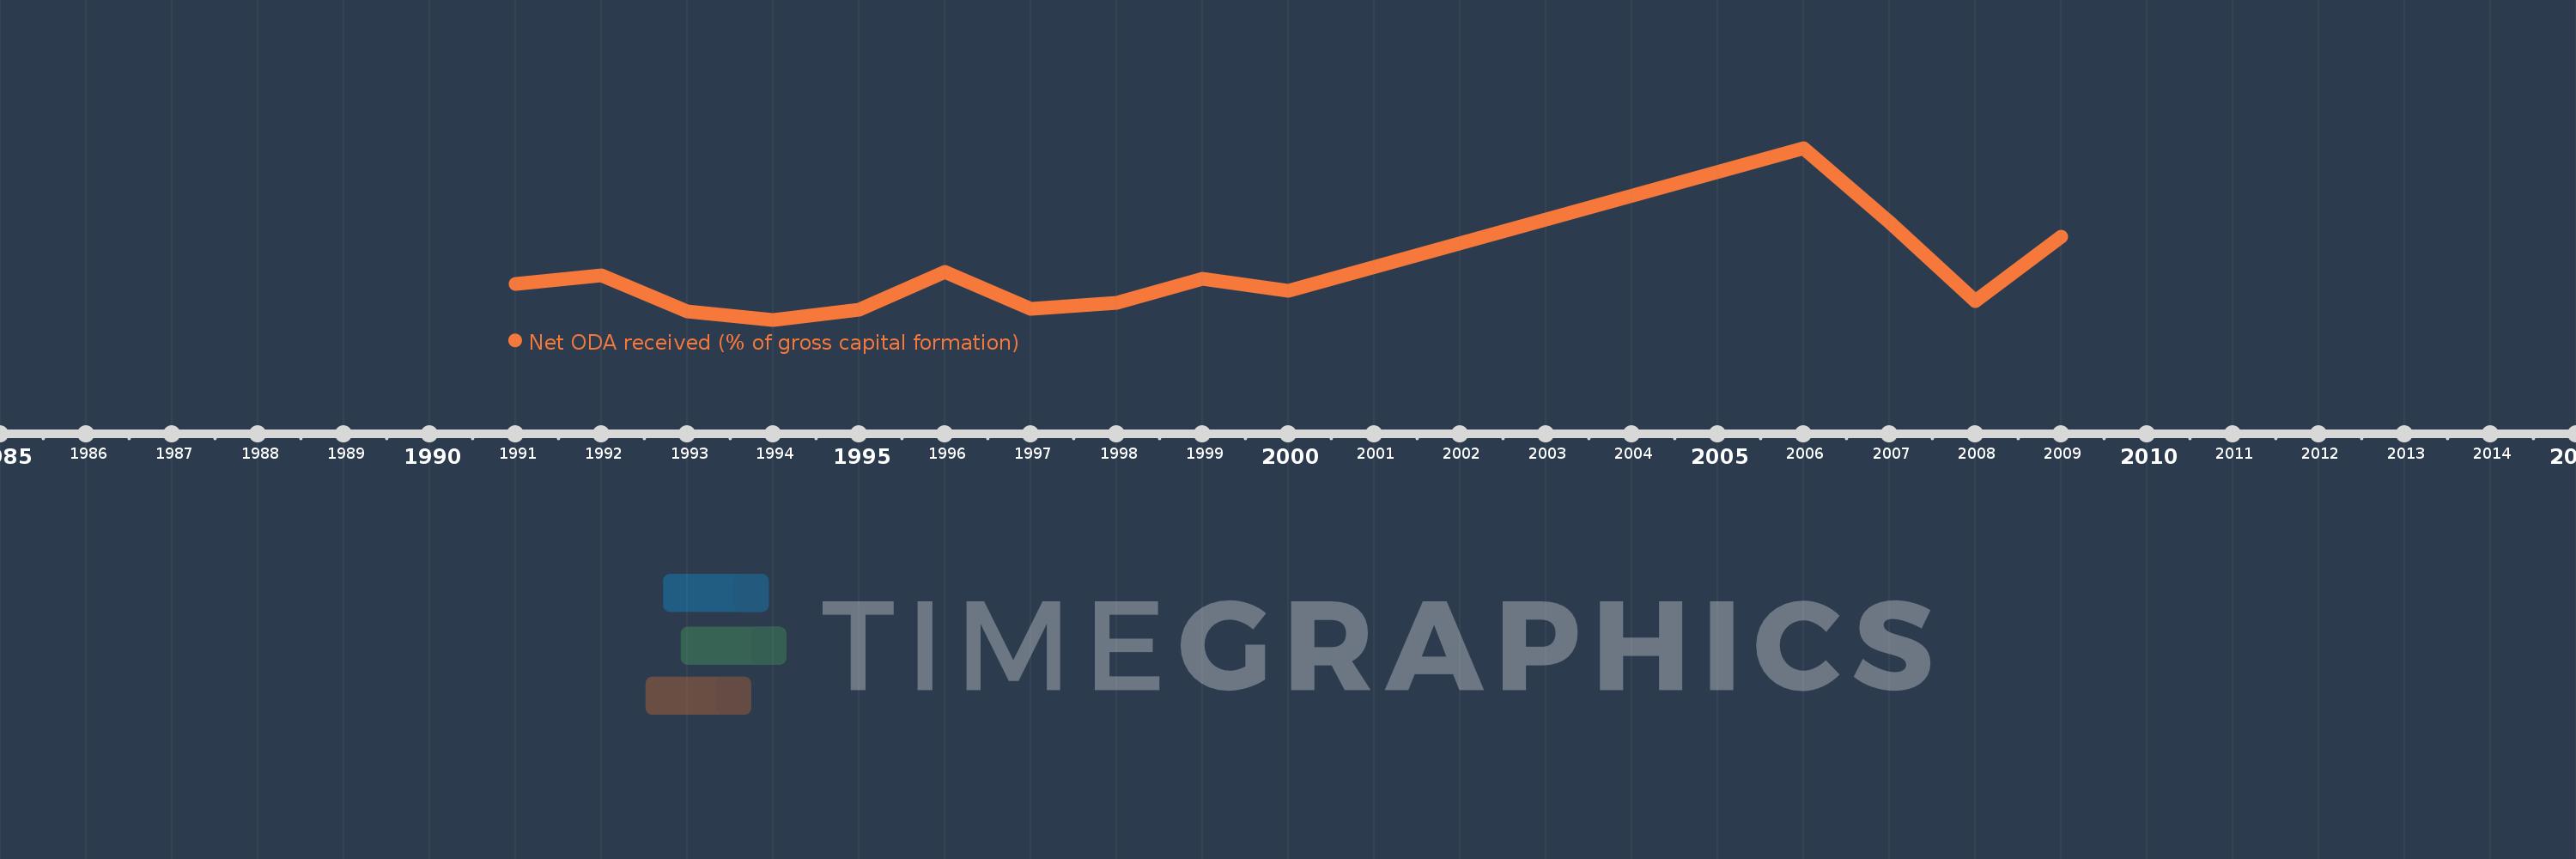
This timeline shows a graph from 1991 to 2009 of Libya. No data until 1990. Number of actual observations by date: 14.
Source name:
World Development Indicators
Source organization:
Development Assistance Committee of the Organisation for Economic Co-operation and Development, Geographical Distribution of Financial Flows to Developing Countries, Development Co-operation Report, and International Development Statistics database. Data are available online at: www.oecd.org/dac/stats/idsonline. World Bank gross capital formation estimates are used for the denominator.
Categories, topics:
Aid Effectiveness
Last updated:
apr 23, 2017
Indicators value changes by year
Meaning:
0.178
Minimum:
0.058
jan 1, 1994
Maximum:
0.528
jan 1, 2006
At the date of observation
Value
Absolute change
Change from the previous value
jan 1, 1991
0.155
+0.155
0.0%
jan 1, 1992
0.179
+0.024
15.18%
jan 1, 1993
0.08
-0.099
-55.37%
jan 1, 1994
0.058
-0.022
-27.83%
jan 1, 1995
0.085
+0.027
47.03%
jan 1, 1996
0.188
+0.103
122.36%
jan 1, 1997
0.087
-0.101
-53.61%
jan 1, 1998
0.105
+0.018
20.25%
jan 1, 1999
0.17
+0.065
62.36%
jan 1, 2000
0.138
-0.032
-19.08%
jan 1, 2006
0.528
+0.39
282.96%
jan 1, 2007
0.325
-0.203
-38.5%
jan 1, 2008
0.11
-0.214
-66.06%
jan 1, 2009
0.285
+0.175
159.17%
Ranking of countries by current statistics by years