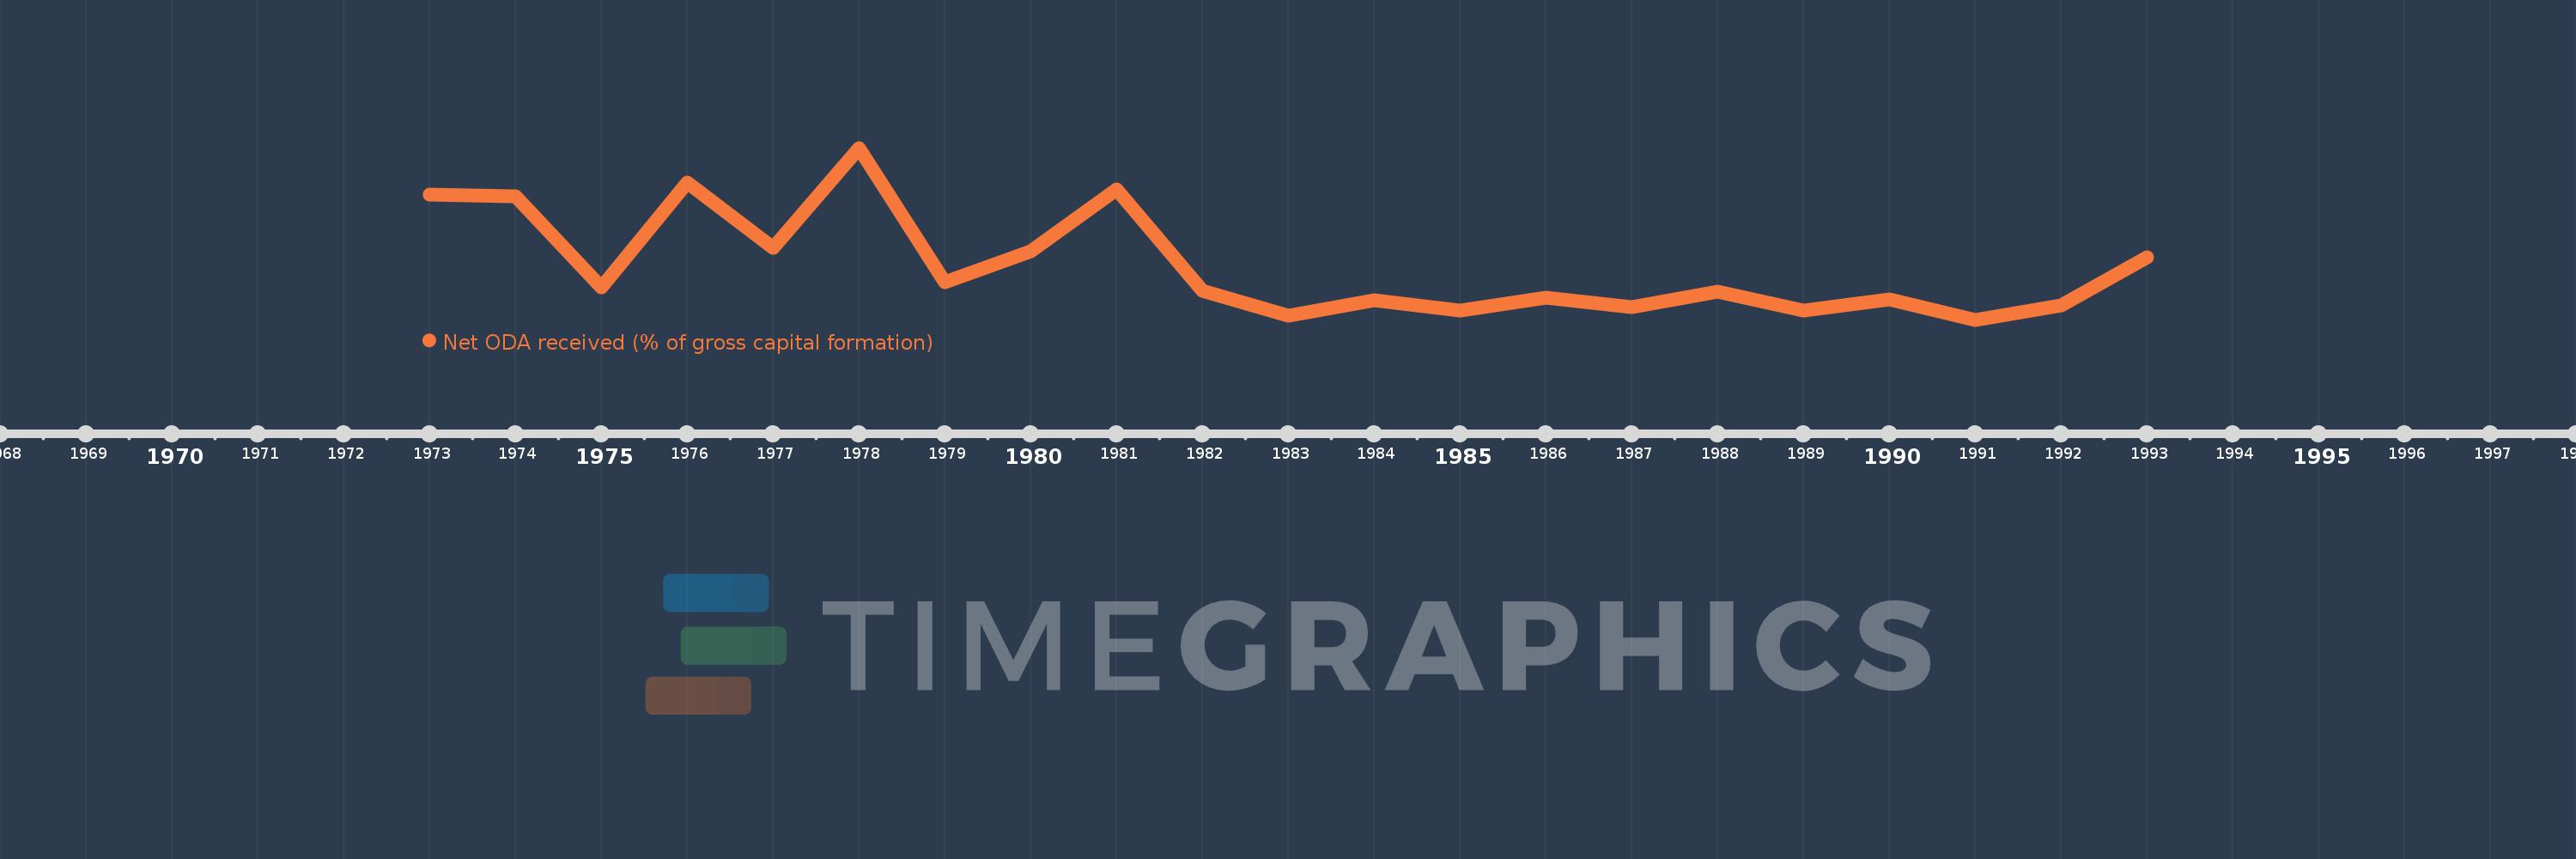
This timeline shows a graph from 1973 to 1993 of Kiribati. No data until 1972. Number of actual observations by date: 21.
Source name:
World Development Indicators
Source organization:
Development Assistance Committee of the Organisation for Economic Co-operation and Development, Geographical Distribution of Financial Flows to Developing Countries, Development Co-operation Report, and International Development Statistics database. Data are available online at: www.oecd.org/dac/stats/idsonline. World Bank gross capital formation estimates are used for the denominator.
Categories, topics:
Aid Effectiveness
Last updated:
apr 23, 2017
Indicators value changes by year
Meaning:
130.372
Minimum:
76.413
jan 1, 1991
Maximum:
248.842
jan 1, 1978
At the date of observation
Value
Absolute change
Change from the previous value
jan 1, 1973
202.148
+202.148
0.0%
jan 1, 1974
200.305
-1.843
-0.91%
jan 1, 1975
109.152
-91.153
-45.51%
jan 1, 1976
214.043
+104.892
96.1%
jan 1, 1977
148.547
-65.496
-30.6%
jan 1, 1978
248.842
+100.295
67.52%
jan 1, 1979
114.449
-134.393
-54.01%
jan 1, 1980
145.409
+30.96
27.05%
jan 1, 1981
207.119
+61.71
42.44%
jan 1, 1982
105.298
-101.821
-49.16%
jan 1, 1983
80.414
-24.883
-23.63%
jan 1, 1984
96.198
+15.784
19.63%
jan 1, 1985
85.371
-10.827
-11.25%
jan 1, 1986
98.214
+12.843
15.04%
jan 1, 1987
88.852
-9.362
-9.53%
jan 1, 1988
104.887
+16.035
18.05%
jan 1, 1989
85.468
-19.419
-18.51%
jan 1, 1990
96.744
+11.276
13.19%
jan 1, 1991
76.413
-20.331
-21.02%
jan 1, 1992
90.945
+14.533
19.02%
jan 1, 1993
138.988
+48.043
52.83%
Ranking of countries by current statistics by years