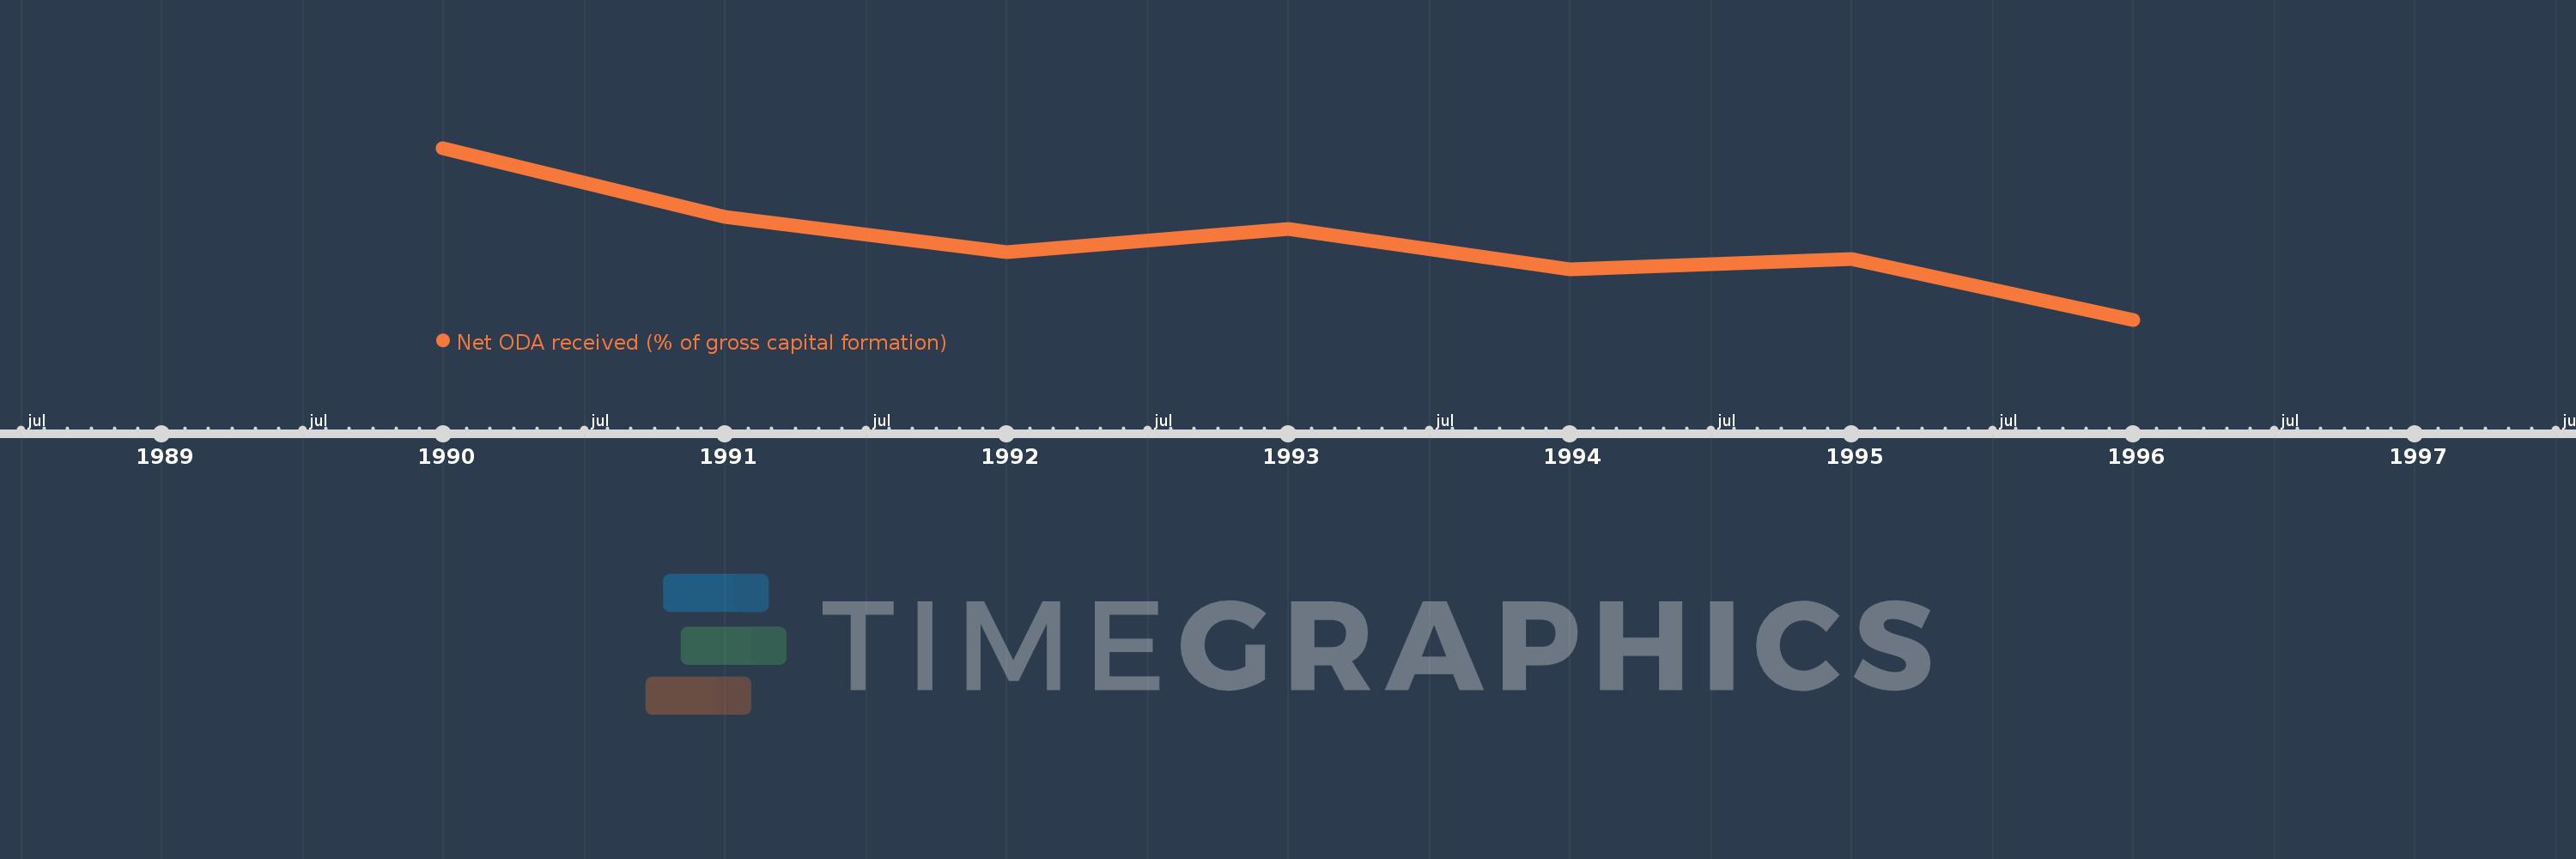
This timeline shows a graph from 1990 to 1996 of Brunei Darussalam. No data until 1989. Number of actual observations by date: 7.
Source name:
World Development Indicators
Source organization:
Development Assistance Committee of the Organisation for Economic Co-operation and Development, Geographical Distribution of Financial Flows to Developing Countries, Development Co-operation Report, and International Development Statistics database. Data are available online at: www.oecd.org/dac/stats/idsonline. World Bank gross capital formation estimates are used for the denominator.
Categories, topics:
Aid Effectiveness
Last updated:
apr 23, 2017
Indicators value changes by year
Meaning:
0.507
Minimum:
0.247
jan 1, 1996
Maximum:
0.822
jan 1, 1990
At the date of observation
Value
Absolute change
Change from the previous value
jan 1, 1990
0.822
+0.822
0.0%
jan 1, 1991
0.59
-0.232
-28.22%
jan 1, 1992
0.474
-0.116
-19.63%
jan 1, 1993
0.552
+0.078
16.4%
jan 1, 1994
0.416
-0.135
-24.54%
jan 1, 1995
0.449
+0.033
7.83%
jan 1, 1996
0.247
-0.202
-44.96%
Ranking of countries by current statistics by years