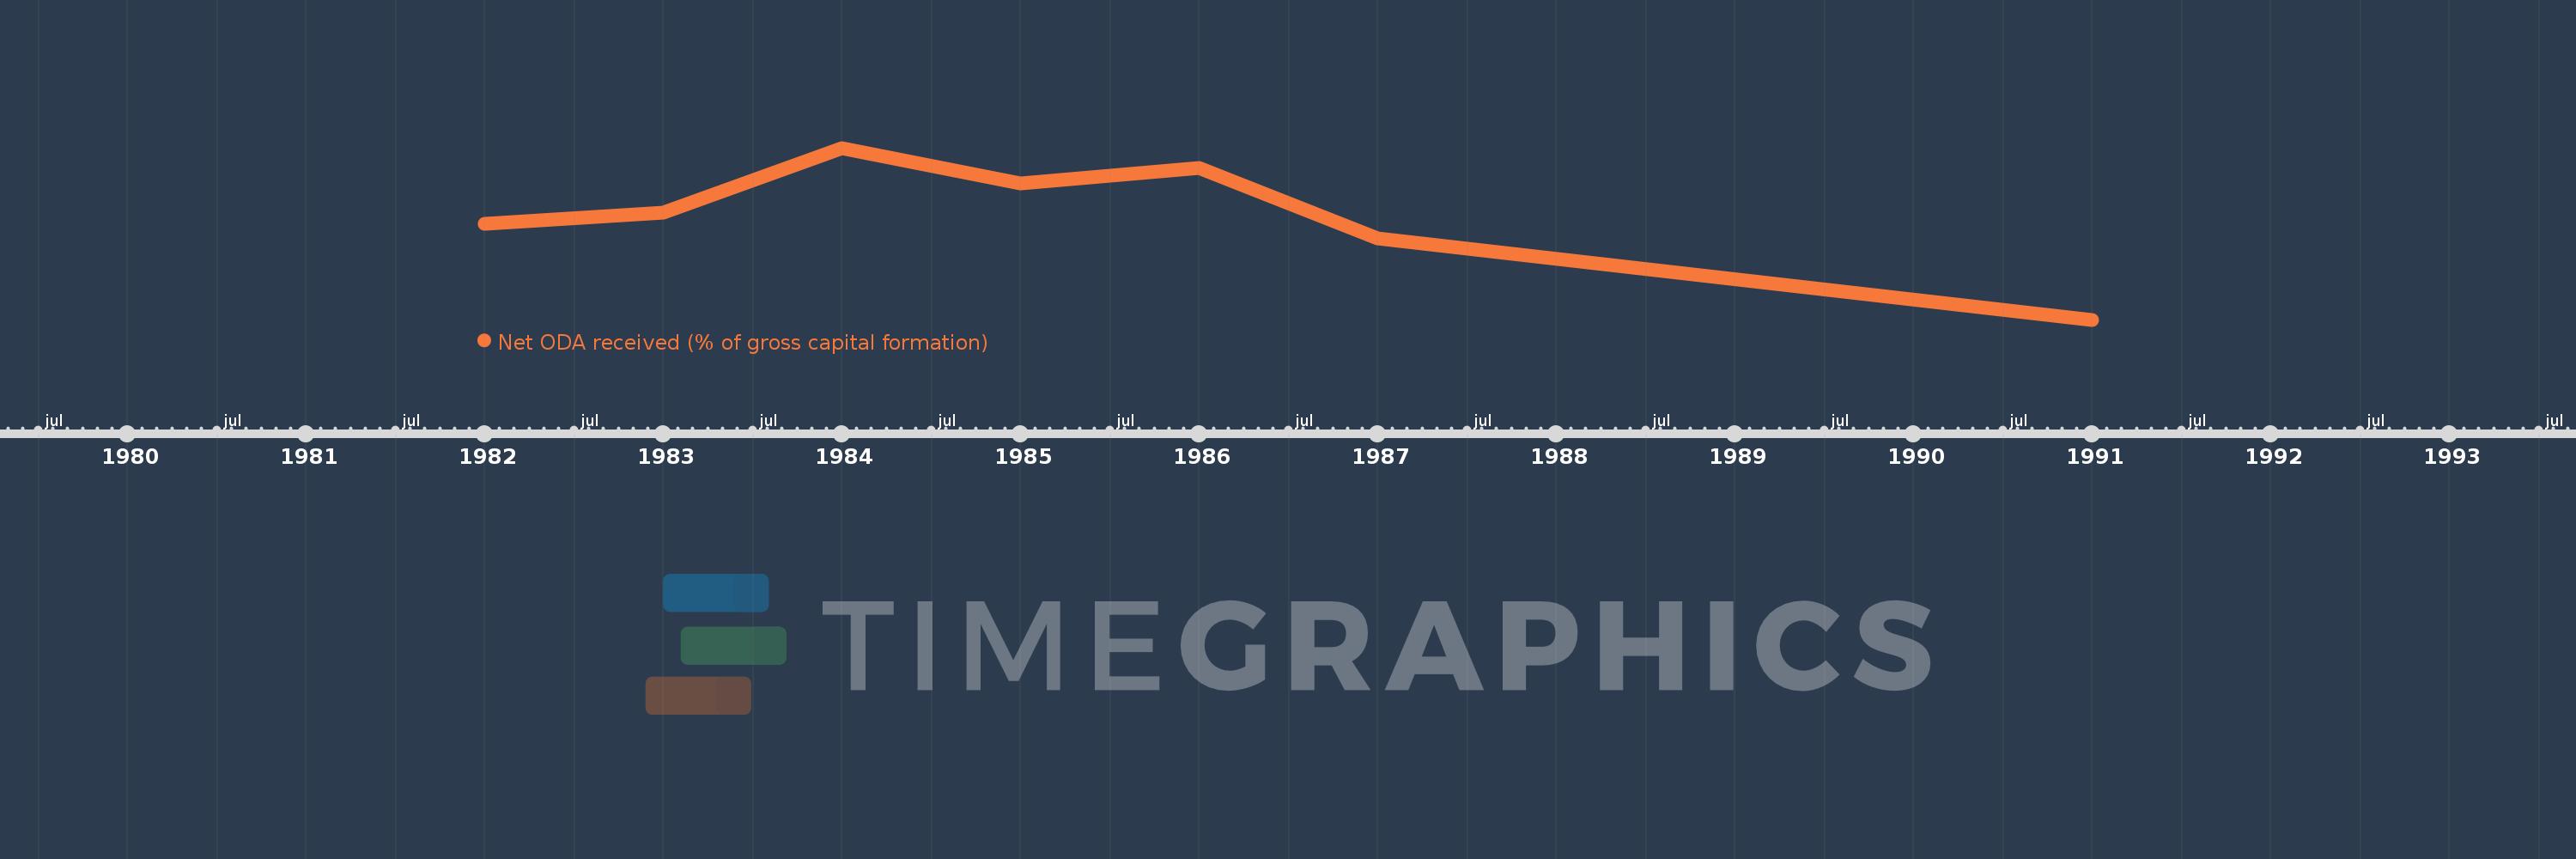
This timeline shows a graph from 1982 to 1991 of New Caledonia. No data until 1981. Number of actual observations by date: 7.
Source name:
World Development Indicators
Source organization:
Development Assistance Committee of the Organisation for Economic Co-operation and Development, Geographical Distribution of Financial Flows to Developing Countries, Development Co-operation Report, and International Development Statistics database. Data are available online at: www.oecd.org/dac/stats/idsonline. World Bank gross capital formation estimates are used for the denominator.
Categories, topics:
Aid Effectiveness
Last updated:
apr 23, 2017
Indicators value changes by year
Meaning:
96.208
Minimum:
38.077
jan 1, 1991
Maximum:
131.971
jan 1, 1984
At the date of observation
Value
Absolute change
Change from the previous value
jan 1, 1982
90.478
+90.478
0.0%
jan 1, 1983
96.726
+6.248
6.91%
jan 1, 1984
131.971
+35.245
36.44%
jan 1, 1985
112.708
-19.263
-14.6%
jan 1, 1986
121.167
+8.458
7.5%
jan 1, 1987
82.332
-38.835
-32.05%
jan 1, 1991
38.077
-44.255
-53.75%
Ranking of countries by current statistics by years