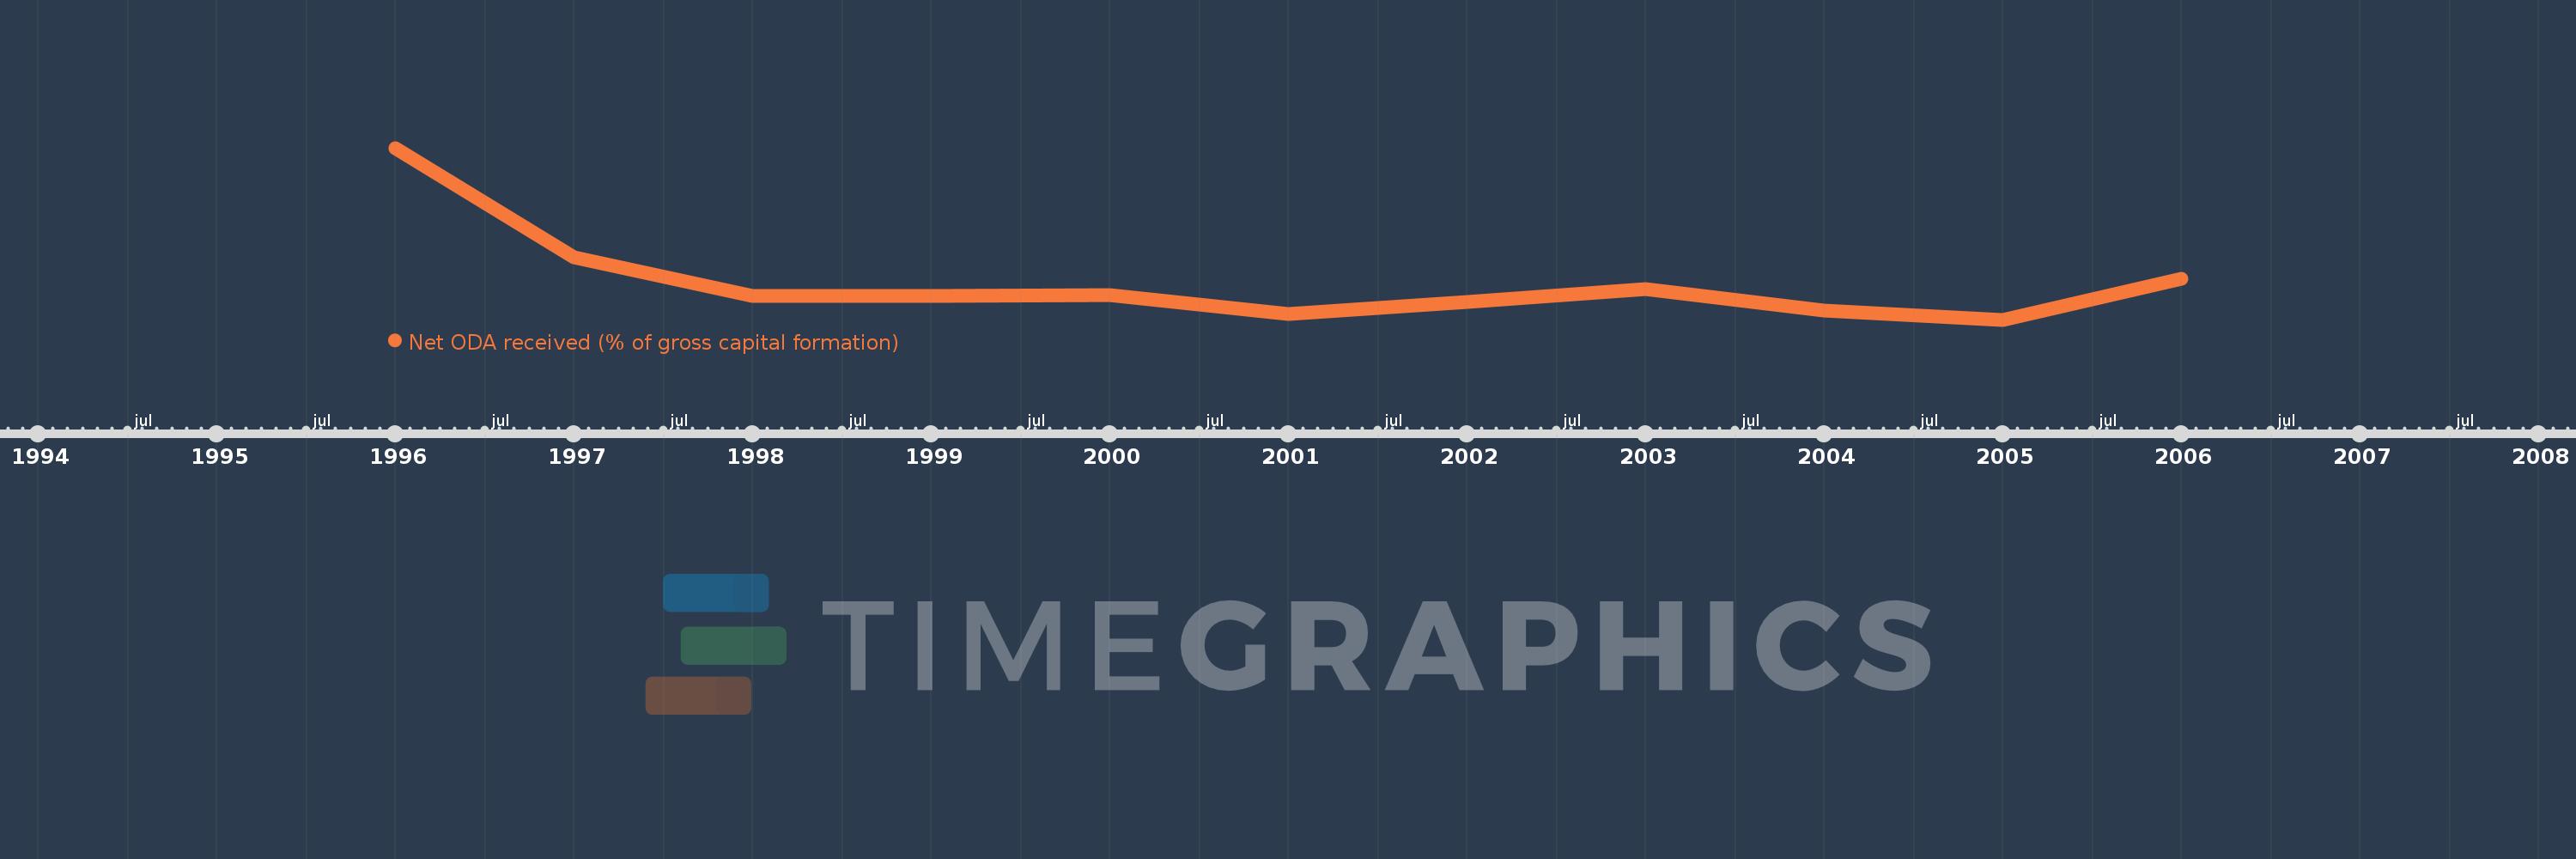
This timeline shows a graph from 1996 to 2006 of Maldives. No data until 1995. Number of actual observations by date: 11.
Source name:
World Development Indicators
Source organization:
Development Assistance Committee of the Organisation for Economic Co-operation and Development, Geographical Distribution of Financial Flows to Developing Countries, Development Co-operation Report, and International Development Statistics database. Data are available online at: www.oecd.org/dac/stats/idsonline. World Bank gross capital formation estimates are used for the denominator.
Categories, topics:
Aid Effectiveness
Last updated:
apr 23, 2017
Indicators value changes by year
Meaning:
18.187
Minimum:
10.385
jan 1, 2005
Maximum:
46.255
jan 1, 1996
At the date of observation
Value
Absolute change
Change from the previous value
jan 1, 1996
46.255
+46.255
0.0%
jan 1, 1997
23.347
-22.908
-49.53%
jan 1, 1998
15.365
-7.981
-34.19%
jan 1, 1999
15.402
+0.036
0.24%
jan 1, 2000
15.478
+0.076
0.5%
jan 1, 2001
11.652
-3.826
-24.72%
jan 1, 2002
14.117
+2.465
21.15%
jan 1, 2003
16.791
+2.674
18.94%
jan 1, 2004
12.364
-4.426
-26.36%
jan 1, 2005
10.385
-1.979
-16.01%
jan 1, 2006
18.904
+8.519
82.03%
Ranking of countries by current statistics by years