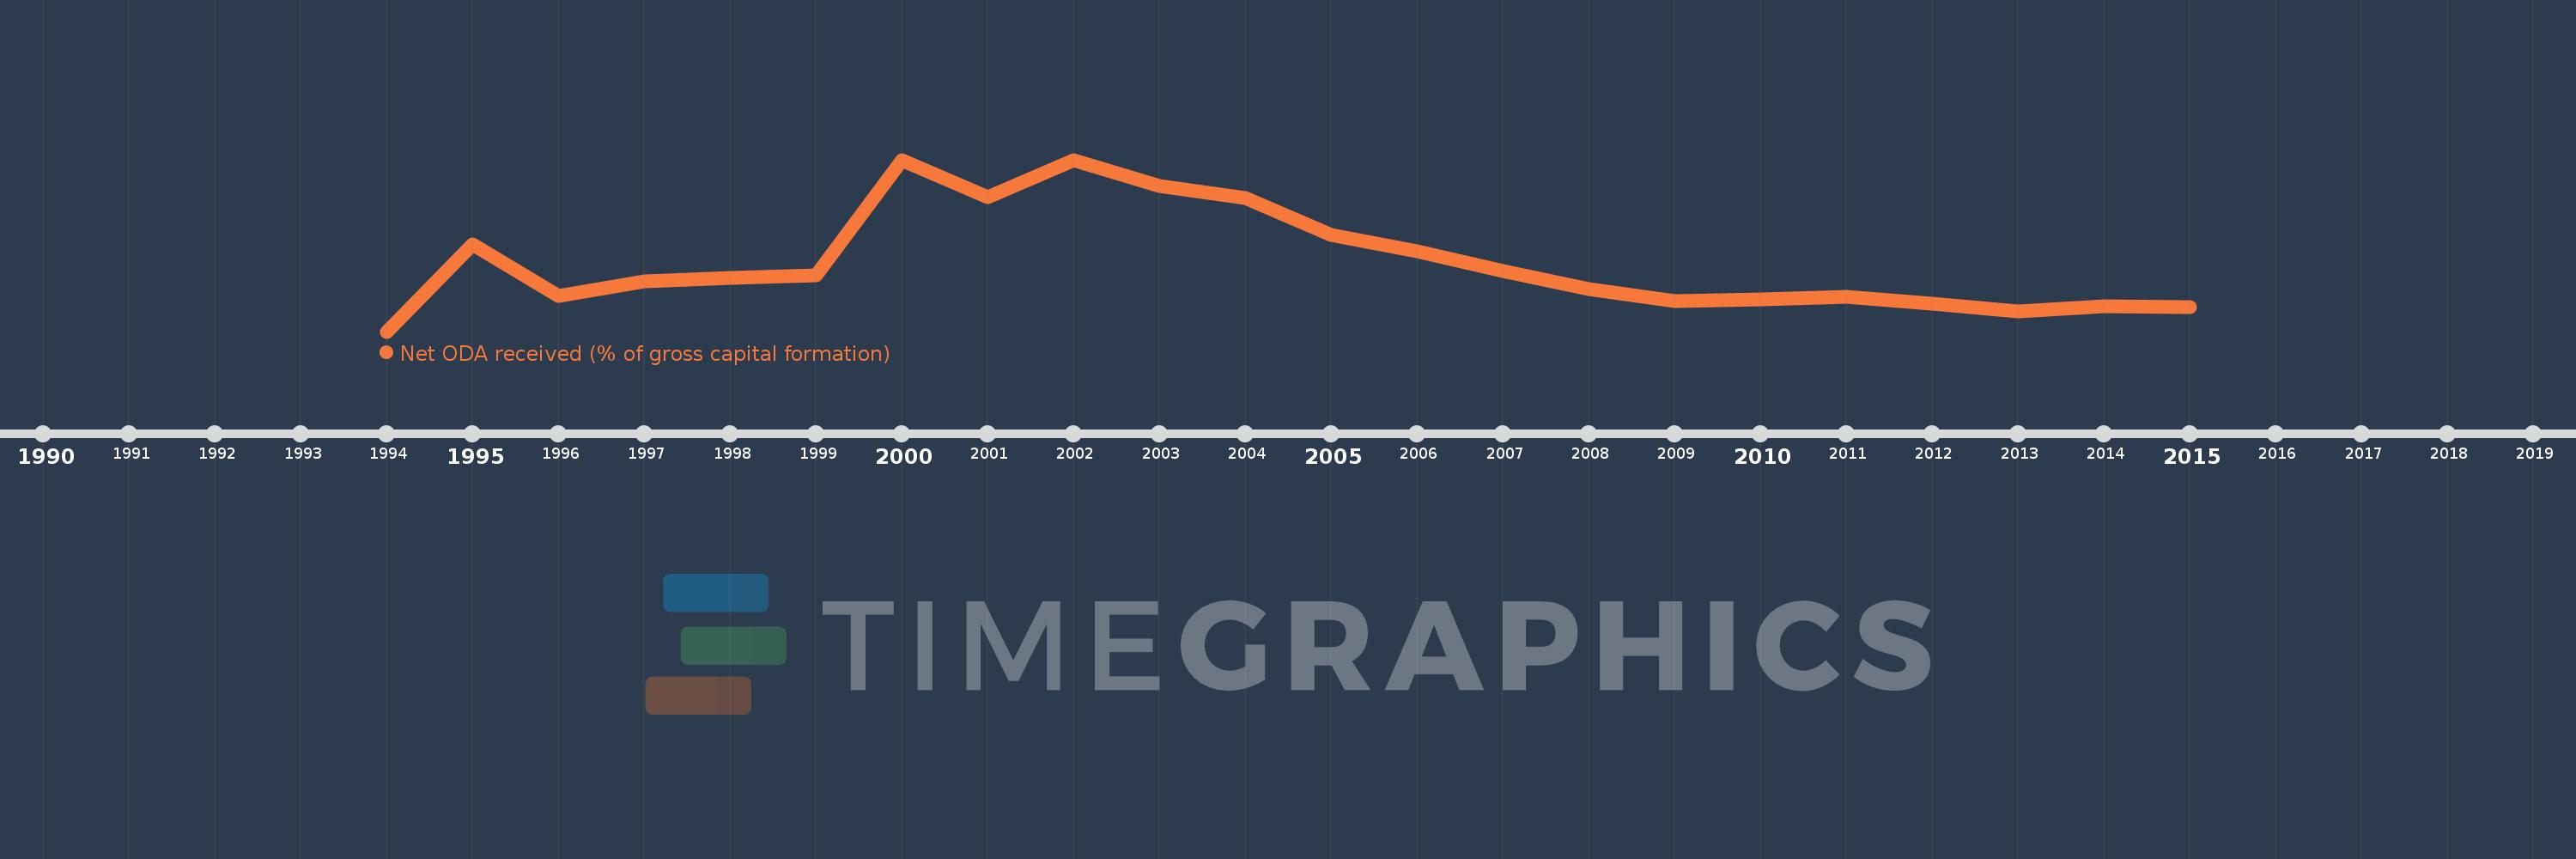
This timeline shows a graph from 1994 to 2015 of Macedonia, FYR. No data until 1993. Number of actual observations by date: 22.
Source name:
World Development Indicators
Source organization:
Development Assistance Committee of the Organisation for Economic Co-operation and Development, Geographical Distribution of Financial Flows to Developing Countries, Development Co-operation Report, and International Development Statistics database. Data are available online at: www.oecd.org/dac/stats/idsonline. World Bank gross capital formation estimates are used for the denominator.
Categories, topics:
Aid Effectiveness
Last updated:
apr 23, 2017
Indicators value changes by year
Meaning:
15.878
Minimum:
0.814
jan 1, 1994
Maximum:
38.396
jan 1, 2002
At the date of observation
Value
Absolute change
Change from the previous value
jan 1, 1994
0.814
+0.814
0.0%
jan 1, 1995
19.938
+19.124
2.35K%
jan 1, 1996
8.532
-11.406
-57.21%
jan 1, 1997
11.864
+3.332
39.05%
jan 1, 1998
12.545
+0.681
5.74%
jan 1, 1999
13.196
+0.651
5.19%
jan 1, 2000
38.259
+25.063
189.93%
jan 1, 2001
30.308
-7.951
-20.78%
jan 1, 2002
38.396
+8.089
26.69%
jan 1, 2003
32.678
-5.718
-14.89%
jan 1, 2004
29.964
-2.715
-8.31%
jan 1, 2005
22.027
-7.936
-26.49%
jan 1, 2006
18.301
-3.727
-16.92%
jan 1, 2007
13.973
-4.327
-23.65%
jan 1, 2008
10.154
-3.819
-27.33%
jan 1, 2009
7.396
-2.759
-27.17%
jan 1, 2010
7.953
+0.557
7.53%
jan 1, 2011
8.377
+0.425
5.34%
jan 1, 2012
6.887
-1.491
-17.79%
jan 1, 2013
5.31
-1.577
-22.89%
jan 1, 2014
6.329
+1.019
19.19%
jan 1, 2015
6.114
-0.215
-3.39%
Ranking of countries by current statistics by years