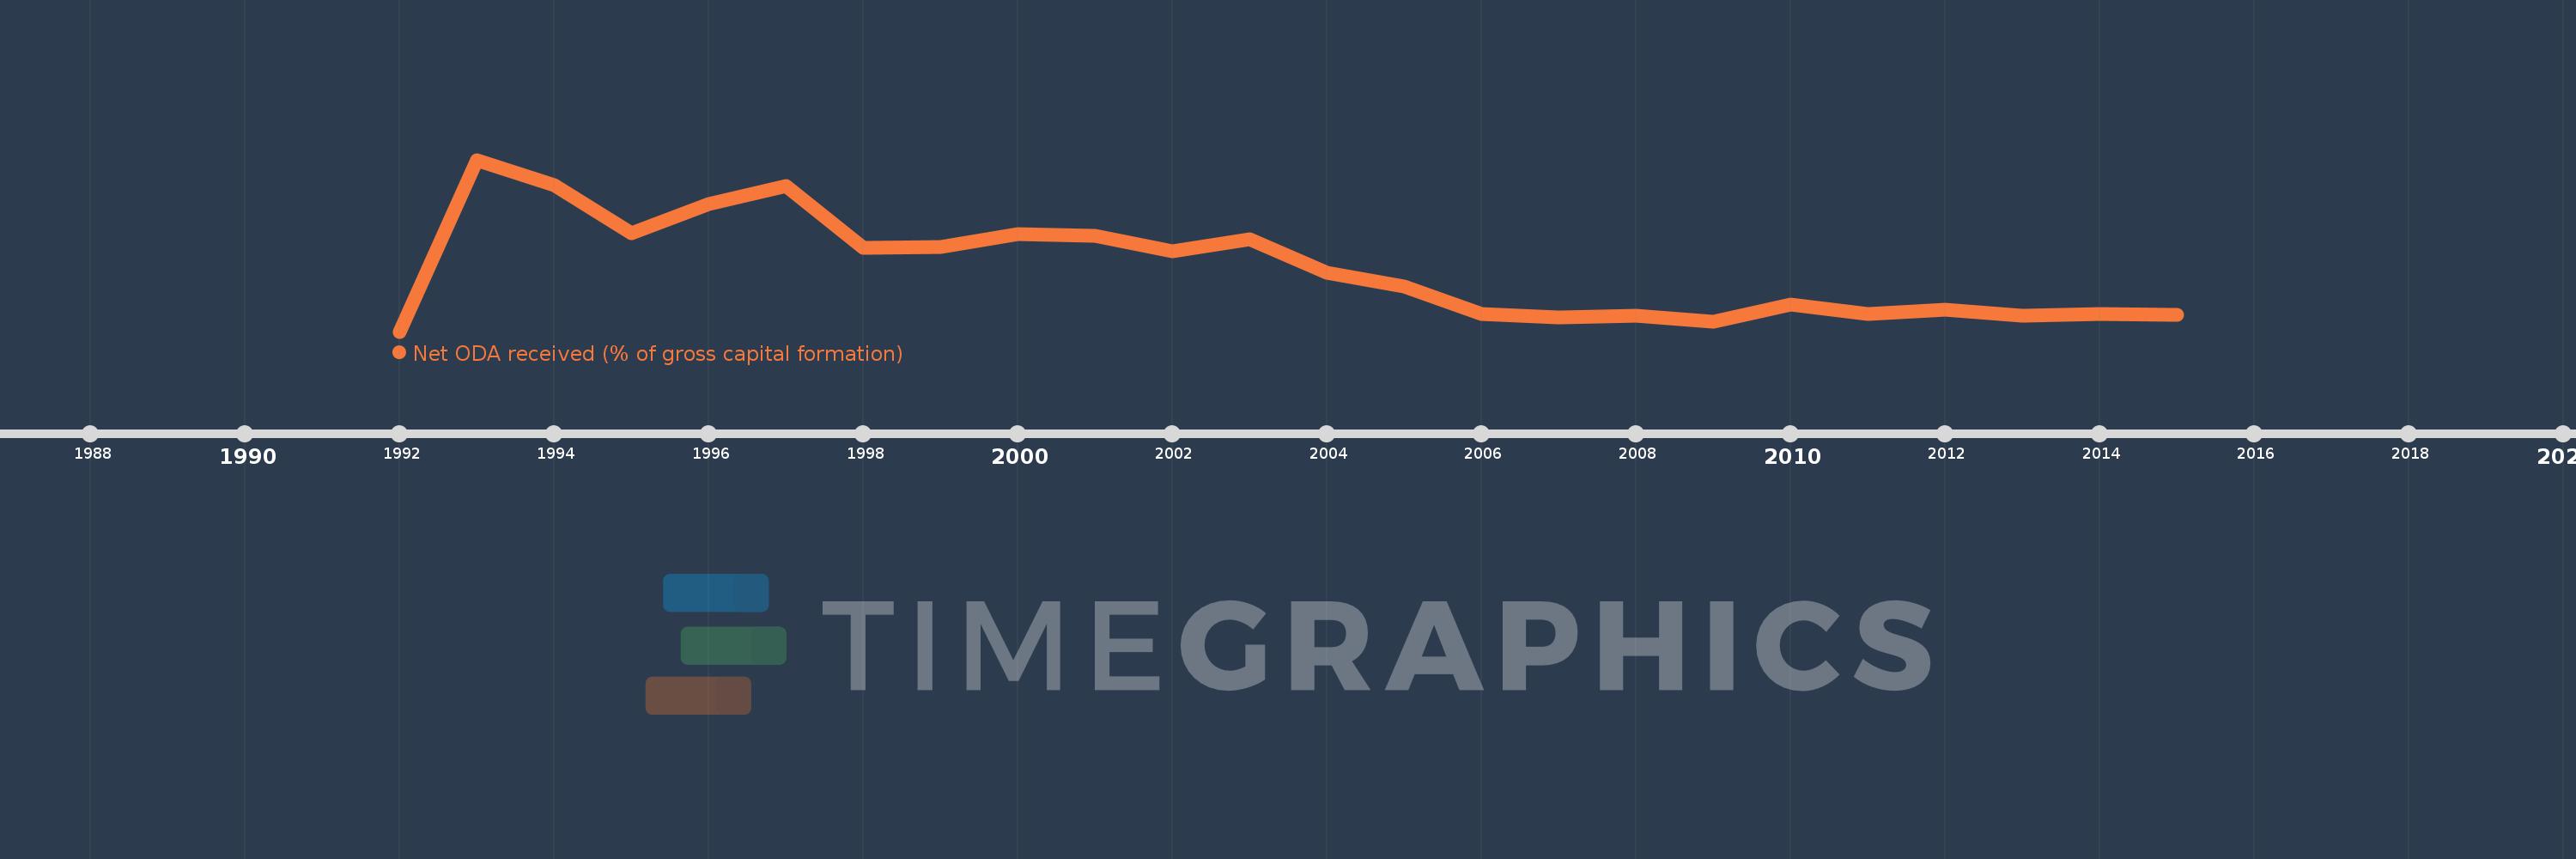
This timeline shows a graph from 1992 to 2015 of Armenia. No data until 1991. Number of actual observations by date: 24.
Source name:
World Development Indicators
Source organization:
Development Assistance Committee of the Organisation for Economic Co-operation and Development, Geographical Distribution of Financial Flows to Developing Countries, Development Co-operation Report, and International Development Statistics database. Data are available online at: www.oecd.org/dac/stats/idsonline. World Bank gross capital formation estimates are used for the denominator.
Categories, topics:
Aid Effectiveness
Last updated:
apr 23, 2017
Indicators value changes by year
Meaning:
39.62
Minimum:
0.331
jan 1, 1992
Maximum:
108.146
jan 1, 1993
At the date of observation
Value
Absolute change
Change from the previous value
jan 1, 1992
0.331
+0.331
0.0%
jan 1, 1993
108.146
+107.815
32.62K%
jan 1, 1994
92.296
-15.849
-14.66%
jan 1, 1995
62.019
-30.278
-32.8%
jan 1, 1996
80.431
+18.412
29.69%
jan 1, 1997
91.445
+11.014
13.69%
jan 1, 1998
53.139
-38.306
-41.89%
jan 1, 1999
53.589
+0.45
0.85%
jan 1, 2000
61.762
+8.173
15.25%
jan 1, 2001
60.578
-1.184
-1.92%
jan 1, 2002
50.561
-10.017
-16.54%
jan 1, 2003
58.186
+7.625
15.08%
jan 1, 2004
37.272
-20.914
-35.94%
jan 1, 2005
28.479
-8.793
-23.59%
jan 1, 2006
11.409
-17.07
-59.94%
jan 1, 2007
9.401
-2.008
-17.6%
jan 1, 2008
10.063
+0.662
7.04%
jan 1, 2009
6.349
-3.713
-36.9%
jan 1, 2010
17.543
+11.194
176.29%
jan 1, 2011
11.245
-6.298
-35.9%
jan 1, 2012
14.346
+3.101
27.58%
jan 1, 2013
10.082
-4.265
-29.73%
jan 1, 2014
11.266
+1.185
11.75%
jan 1, 2015
10.95
-0.316
-2.81%
Ranking of countries by current statistics by years