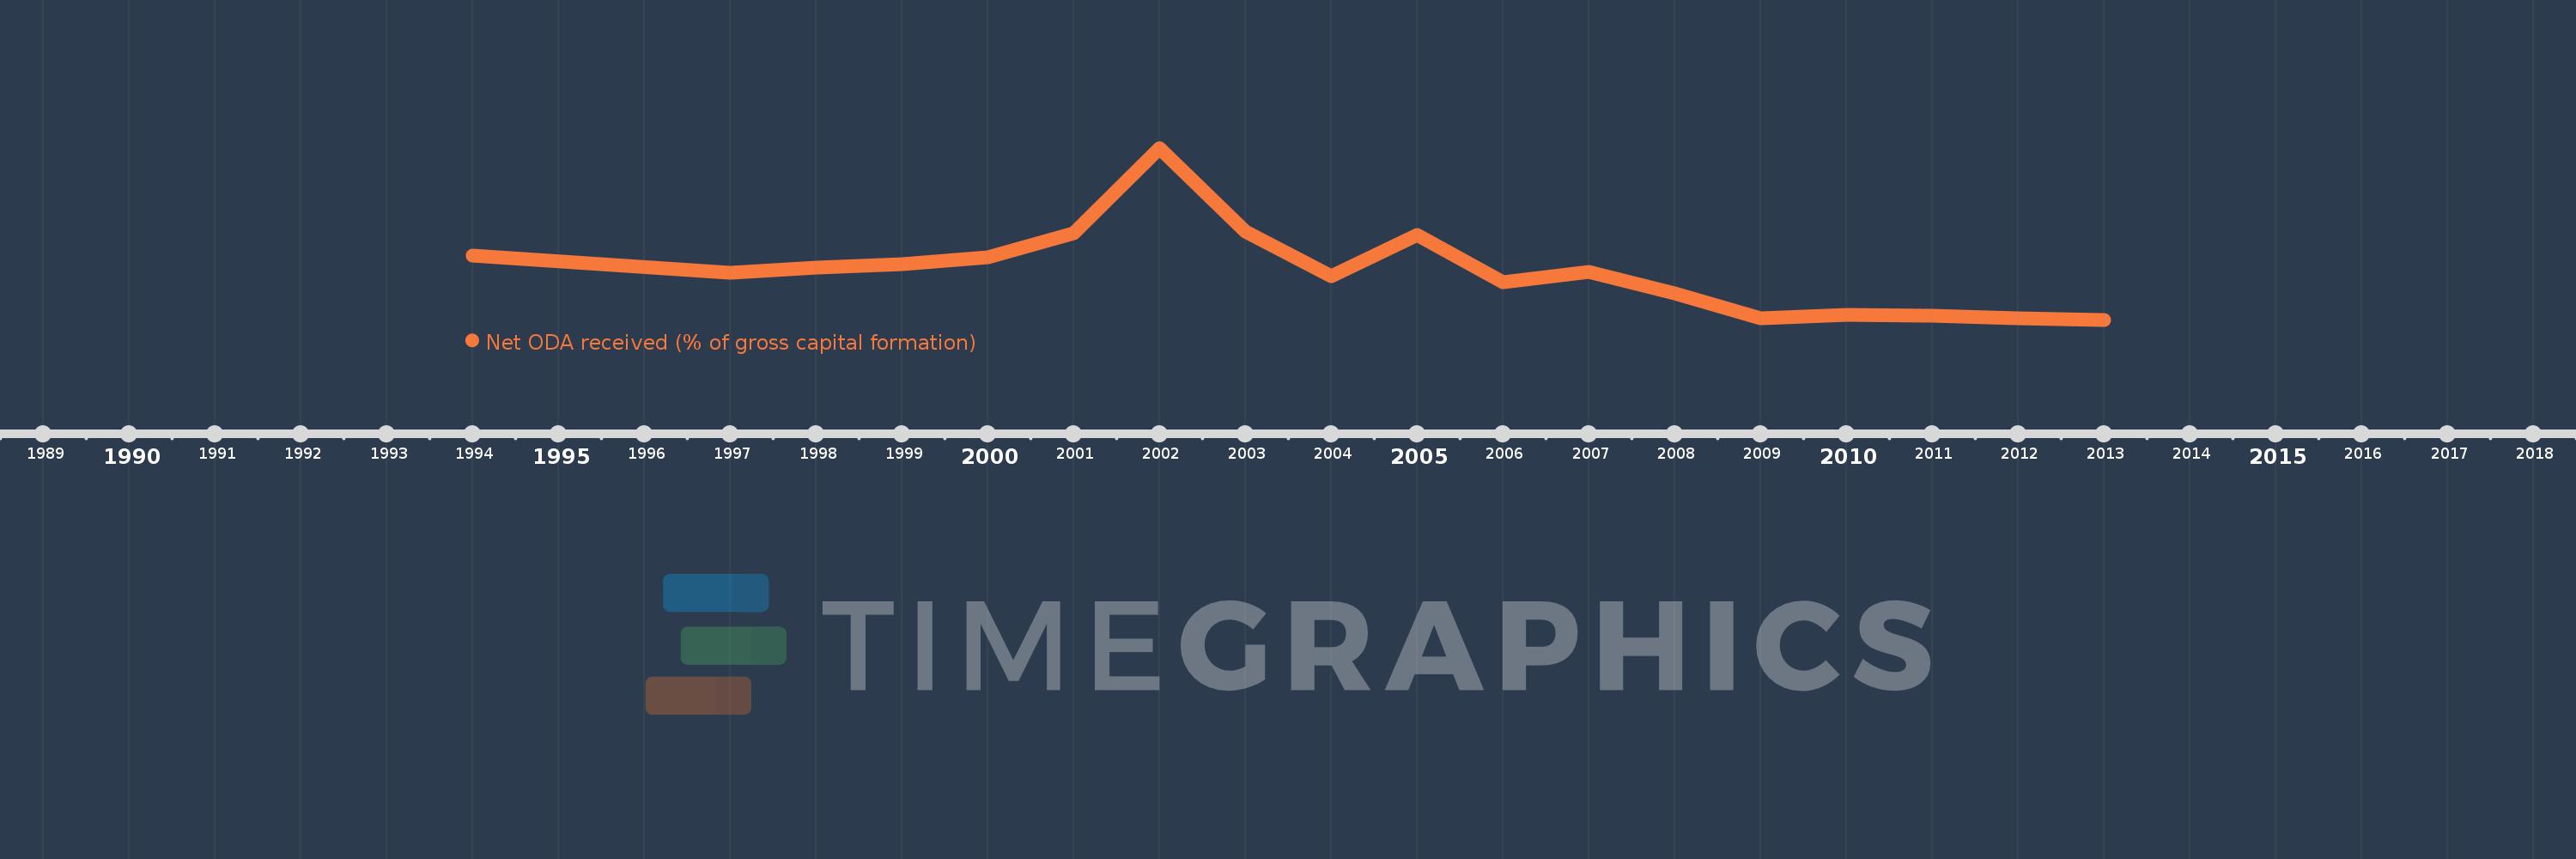
This timeline shows a graph from 1994 to 2013 of Turkmenistan. No data until 1993. Number of actual observations by date: 18.
Source name:
World Development Indicators
Source organization:
Development Assistance Committee of the Organisation for Economic Co-operation and Development, Geographical Distribution of Financial Flows to Developing Countries, Development Co-operation Report, and International Development Statistics database. Data are available online at: www.oecd.org/dac/stats/idsonline. World Bank gross capital formation estimates are used for the denominator.
Categories, topics:
Aid Effectiveness
Last updated:
apr 23, 2017
Indicators value changes by year
Meaning:
2.072
Minimum:
0.227
jan 1, 2013
Maximum:
6.714
jan 1, 2002
At the date of observation
Value
Absolute change
Change from the previous value
jan 1, 1994
2.648
+2.648
0.0%
jan 1, 1997
2.01
-0.639
-24.11%
jan 1, 1998
2.184
+0.174
8.68%
jan 1, 1999
2.312
+0.128
5.86%
jan 1, 2000
2.57
+0.257
11.13%
jan 1, 2001
3.498
+0.929
36.15%
jan 1, 2002
6.714
+3.215
91.91%
jan 1, 2003
3.556
-3.158
-47.03%
jan 1, 2004
1.88
-1.676
-47.14%
jan 1, 2005
3.442
+1.562
83.11%
jan 1, 2006
1.635
-1.807
-52.49%
jan 1, 2007
2.031
+0.396
24.23%
jan 1, 2008
1.209
-0.822
-40.48%
jan 1, 2009
0.297
-0.912
-75.45%
jan 1, 2010
0.423
+0.126
42.51%
jan 1, 2011
0.391
-0.032
-7.63%
jan 1, 2012
0.266
-0.124
-31.81%
jan 1, 2013
0.227
-0.04
-14.87%
Ranking of countries by current statistics by years