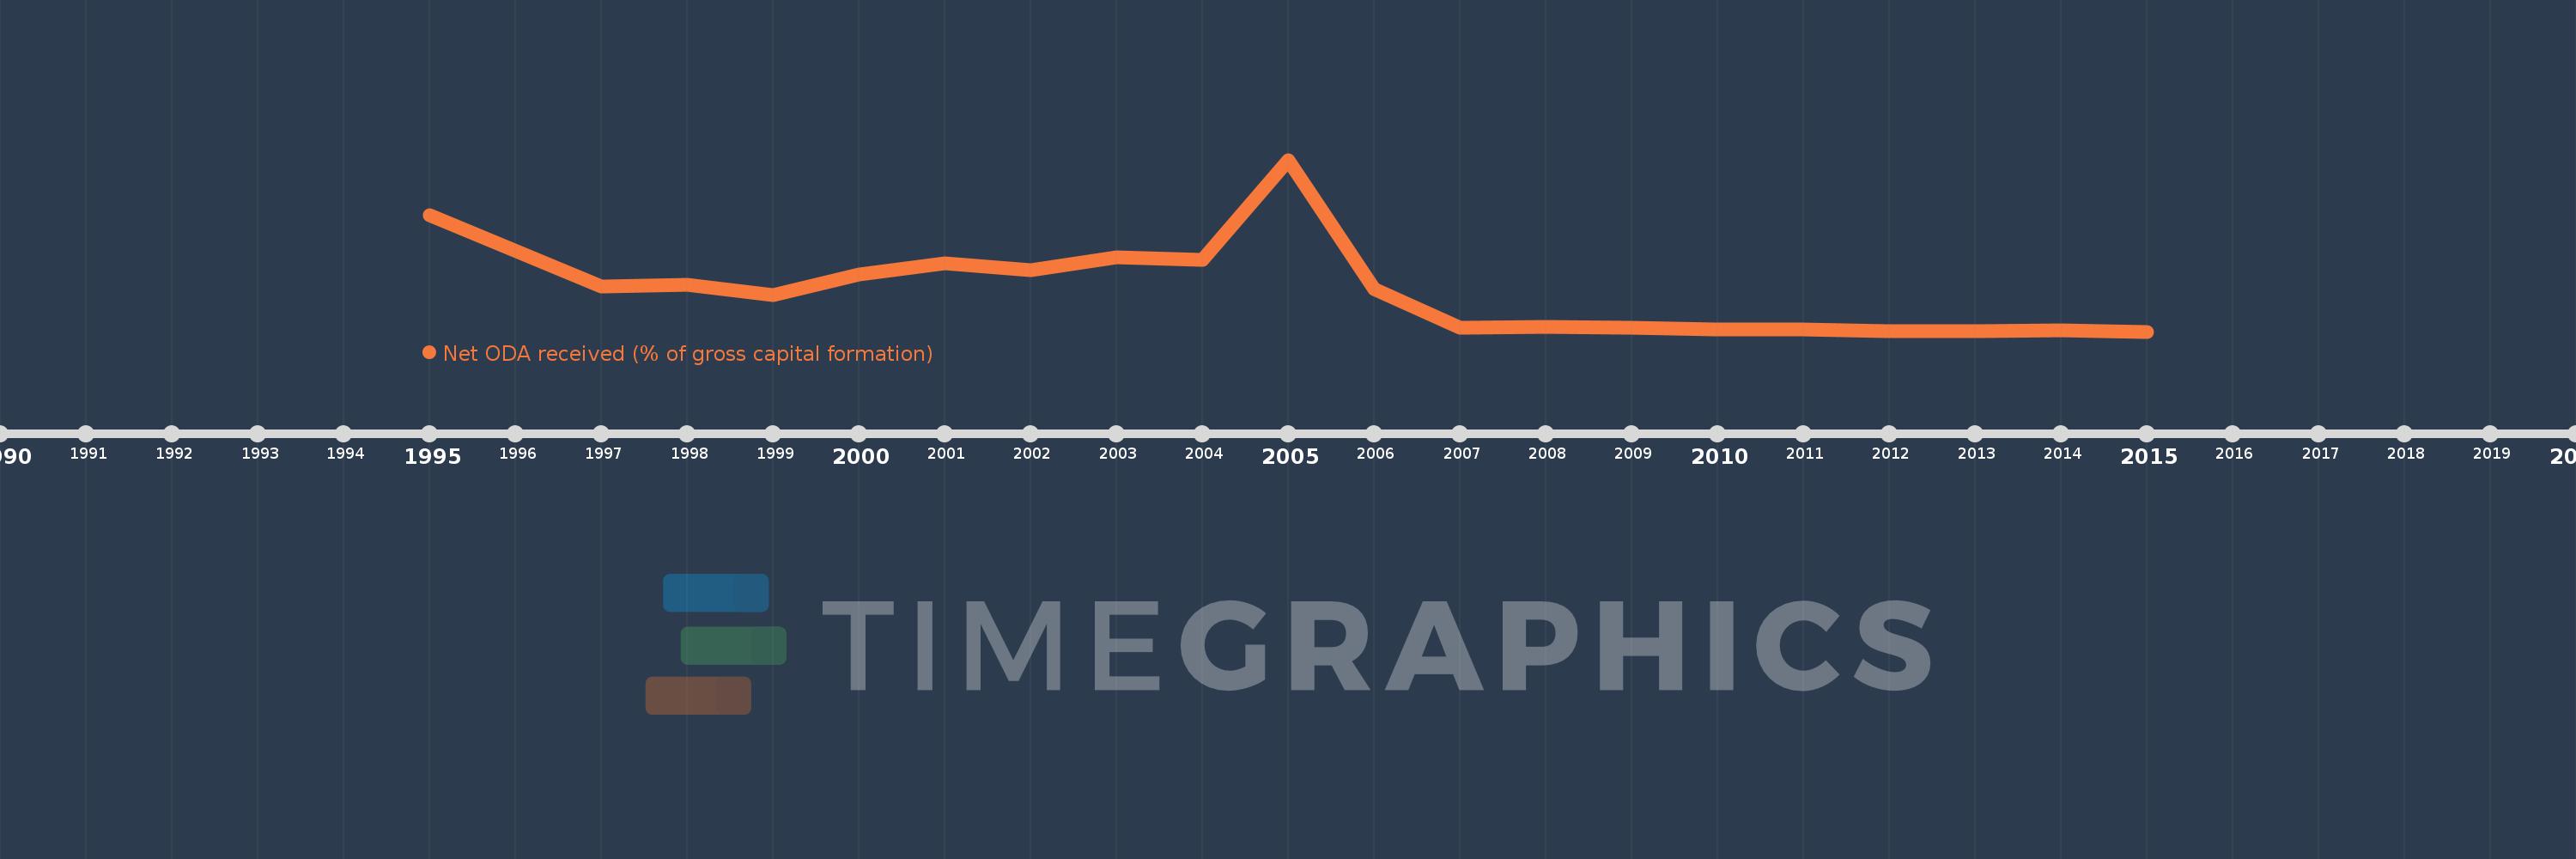
This timeline shows a graph from 1995 to 2015 of Angola. No data until 1994. Number of actual observations by date: 20.
Source name:
World Development Indicators
Source organization:
Development Assistance Committee of the Organisation for Economic Co-operation and Development, Geographical Distribution of Financial Flows to Developing Countries, Development Co-operation Report, and International Development Statistics database. Data are available online at: www.oecd.org/dac/stats/idsonline. World Bank gross capital formation estimates are used for the denominator.
Categories, topics:
Aid Effectiveness
Last updated:
apr 23, 2017
Indicators value changes by year
Meaning:
15.915
Minimum:
1.189
jan 1, 2015
Maximum:
63.566
jan 1, 2005
At the date of observation
Value
Absolute change
Change from the previous value
jan 1, 1995
43.447
+43.447
0.0%
jan 1, 1997
17.524
-25.923
-59.67%
jan 1, 1998
18.139
+0.615
3.51%
jan 1, 1999
14.586
-3.552
-19.58%
jan 1, 2000
21.794
+7.208
49.41%
jan 1, 2001
25.952
+4.158
19.08%
jan 1, 2002
23.522
-2.43
-9.36%
jan 1, 2003
28.027
+4.505
19.15%
jan 1, 2004
27.094
-0.933
-3.33%
jan 1, 2005
63.566
+36.472
134.61%
jan 1, 2006
16.725
-46.84
-73.69%
jan 1, 2007
2.547
-14.178
-84.77%
jan 1, 2008
3.034
+0.487
19.1%
jan 1, 2009
2.701
-0.332
-10.96%
jan 1, 2010
2.076
-0.625
-23.14%
jan 1, 2011
1.991
-0.086
-4.13%
jan 1, 2012
1.434
-0.556
-27.94%
jan 1, 2013
1.401
-0.033
-2.34%
jan 1, 2014
1.54
+0.139
9.91%
jan 1, 2015
1.189
-0.351
-22.77%
Ranking of countries by current statistics by years