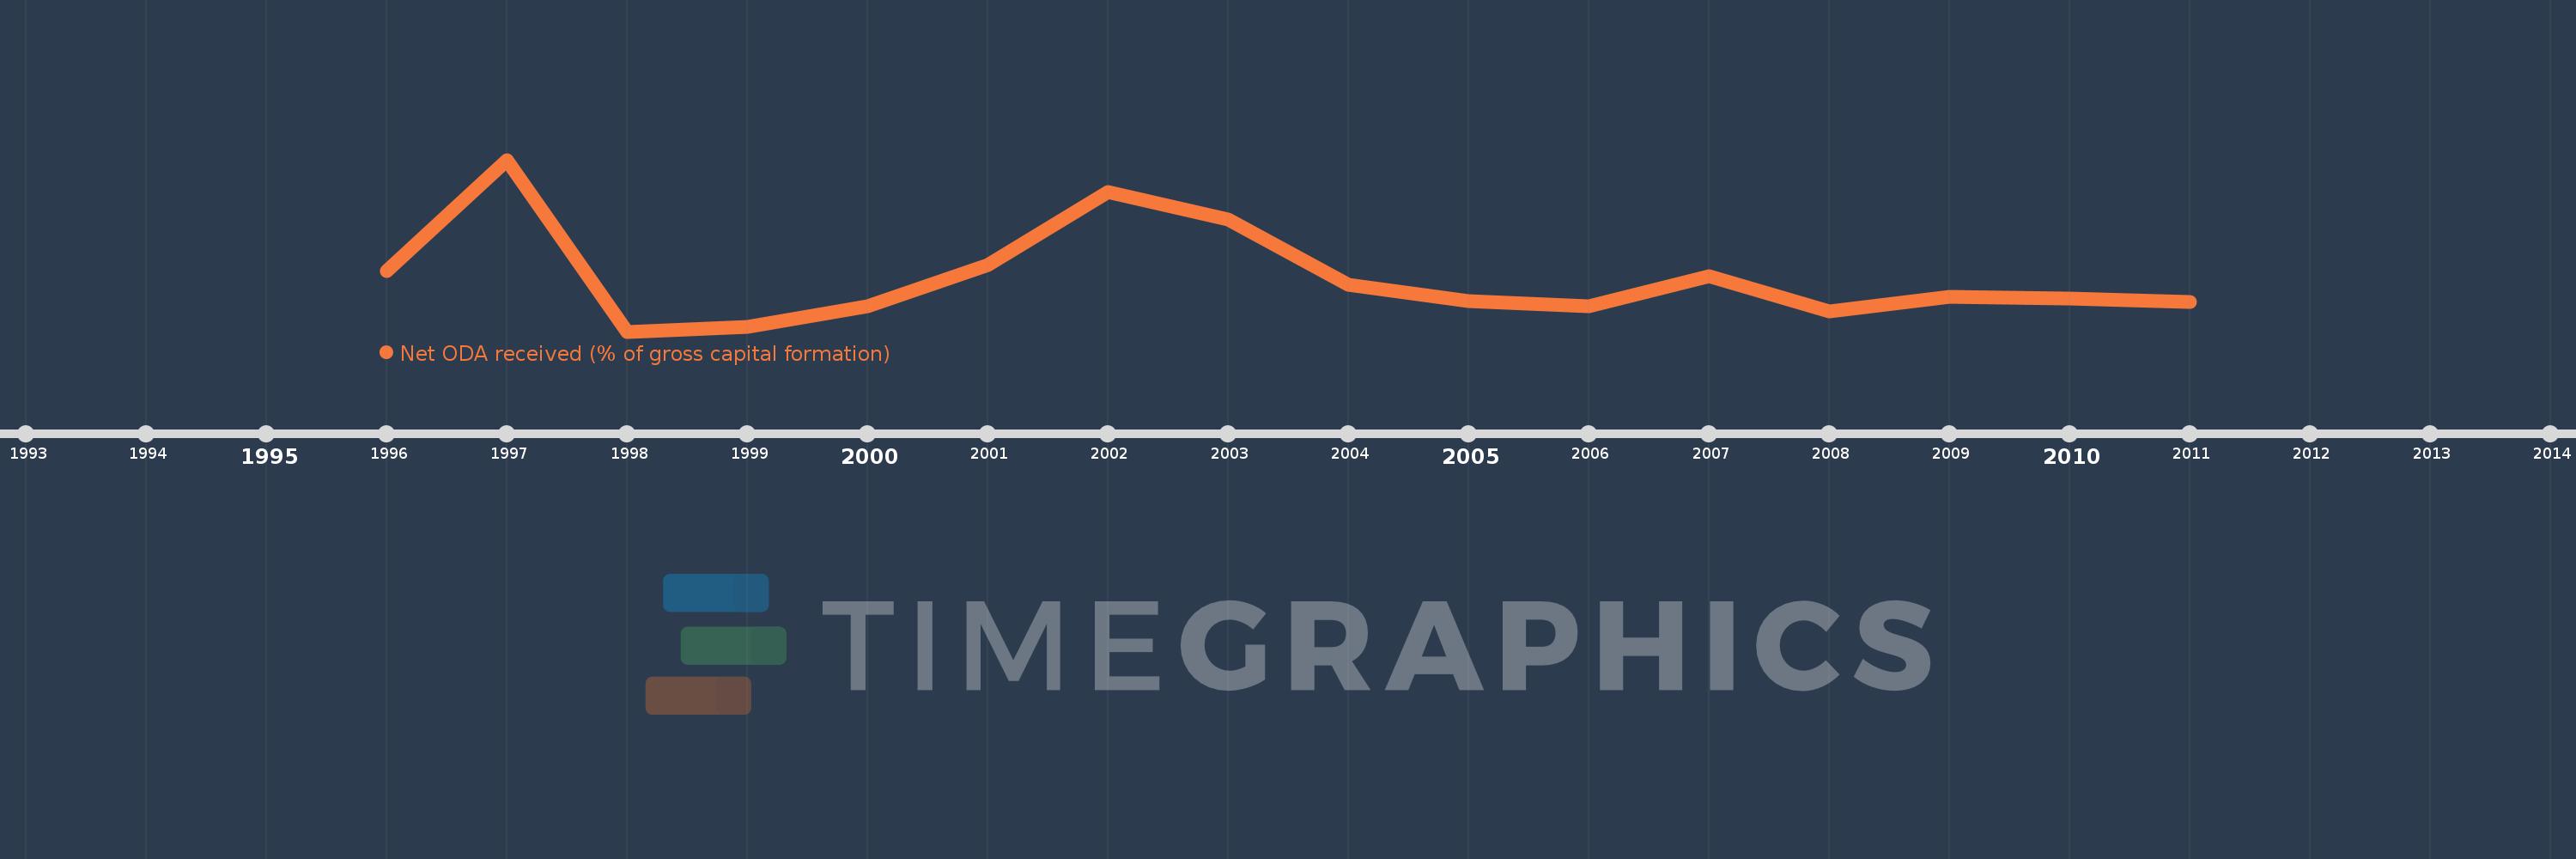
This timeline shows a graph from 1996 to 2011 of Croatia. No data until 1995. Number of actual observations by date: 16.
Source name:
World Development Indicators
Source organization:
Development Assistance Committee of the Organisation for Economic Co-operation and Development, Geographical Distribution of Financial Flows to Developing Countries, Development Co-operation Report, and International Development Statistics database. Data are available online at: www.oecd.org/dac/stats/idsonline. World Bank gross capital formation estimates are used for the denominator.
Categories, topics:
Aid Effectiveness
Last updated:
apr 23, 2017
Indicators value changes by year
Meaning:
1.328
Minimum:
0.661
jan 1, 1998
Maximum:
2.8
jan 1, 1997
At the date of observation
Value
Absolute change
Change from the previous value
jan 1, 1996
1.413
+1.413
0.0%
jan 1, 1997
2.8
+1.387
98.11%
jan 1, 1998
0.661
-2.139
-76.39%
jan 1, 1999
0.717
+0.056
8.41%
jan 1, 2000
0.975
+0.258
36.01%
jan 1, 2001
1.493
+0.518
53.17%
jan 1, 2002
2.404
+0.911
61.02%
jan 1, 2003
2.054
-0.35
-14.57%
jan 1, 2004
1.244
-0.809
-39.41%
jan 1, 2005
1.045
-0.199
-16.0%
jan 1, 2006
0.973
-0.072
-6.92%
jan 1, 2007
1.355
+0.382
39.29%
jan 1, 2008
0.913
-0.443
-32.66%
jan 1, 2009
1.09
+0.178
19.47%
jan 1, 2010
1.075
-0.015
-1.38%
jan 1, 2011
1.032
-0.043
-3.99%
Ranking of countries by current statistics by years