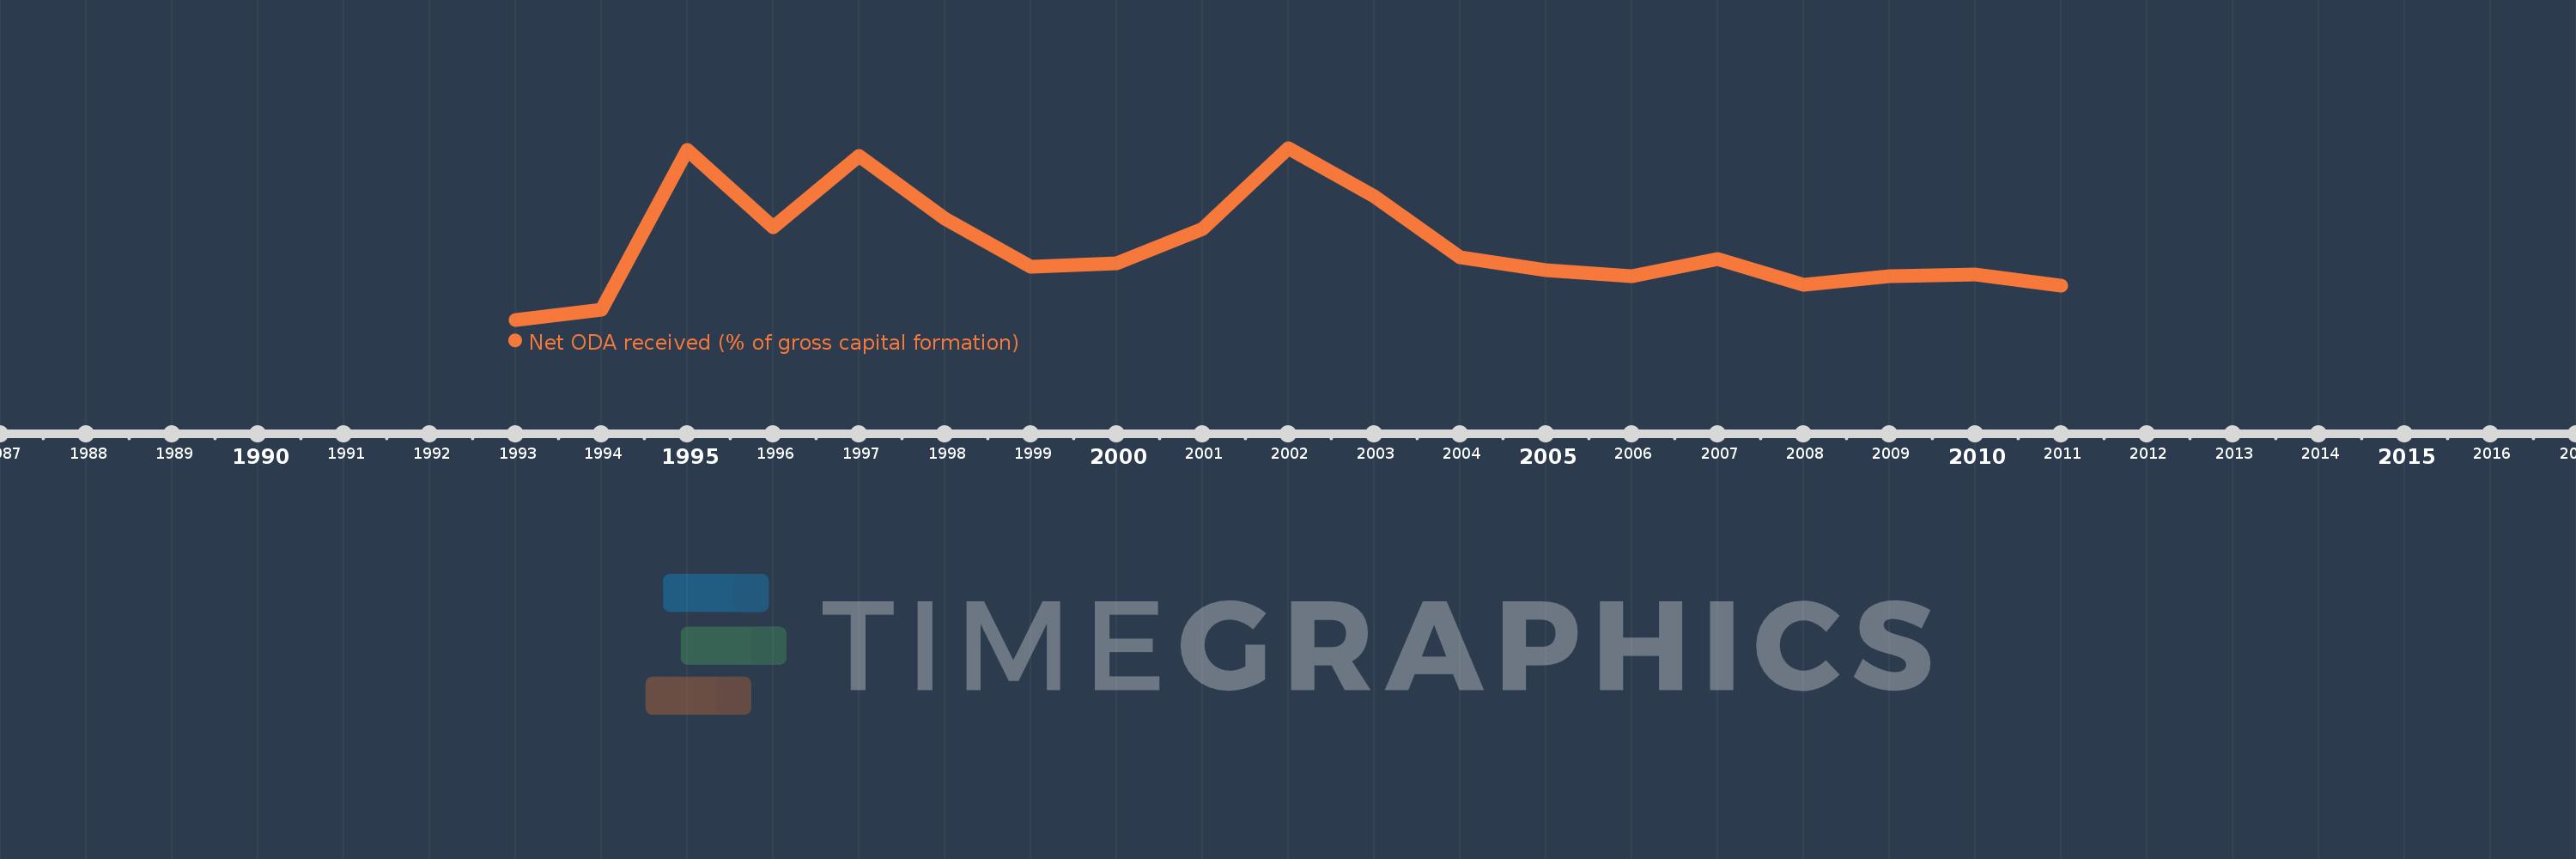
This timeline shows a graph from 1993 to 2011 of Central Europe and the Baltics. No data until 1992. Number of actual observations by date: 19.
Source name:
World Development Indicators
Source organization:
Development Assistance Committee of the Organisation for Economic Co-operation and Development, Geographical Distribution of Financial Flows to Developing Countries, Development Co-operation Report, and International Development Statistics database. Data are available online at: www.oecd.org/dac/stats/idsonline. World Bank gross capital formation estimates are used for the denominator.
Categories, topics:
Aid Effectiveness
Last updated:
apr 23, 2017
Indicators value changes by year
Meaning:
0.094
Minimum:
0.0
jan 1, 1993
Maximum:
0.219
jan 1, 2002
At the date of observation
Value
Absolute change
Change from the previous value
jan 1, 1993
0.0
+0.0
0.0%
jan 1, 1994
0.013
+0.013
65.71K%
jan 1, 1995
0.216
+0.203
1.57K%
jan 1, 1996
0.118
-0.098
-45.28%
jan 1, 1997
0.209
+0.091
76.93%
jan 1, 1998
0.129
-0.079
-38.03%
jan 1, 1999
0.068
-0.062
-47.74%
jan 1, 2000
0.072
+0.005
6.88%
jan 1, 2001
0.116
+0.044
60.28%
jan 1, 2002
0.219
+0.103
89.3%
jan 1, 2003
0.157
-0.062
-28.29%
jan 1, 2004
0.08
-0.077
-48.84%
jan 1, 2005
0.063
-0.018
-21.87%
jan 1, 2006
0.056
-0.007
-10.69%
jan 1, 2007
0.077
+0.02
36.31%
jan 1, 2008
0.045
-0.032
-41.5%
jan 1, 2009
0.055
+0.011
23.79%
jan 1, 2010
0.058
+0.002
4.16%
jan 1, 2011
0.044
-0.014
-24.62%
Ranking of countries by current statistics by years