29
/
en
AIzaSyAYiBZKx7MnpbEhh9jyipgxe19OcubqV5w
April 1, 2024
94828
Burkina Faso
BFA
true
2
1
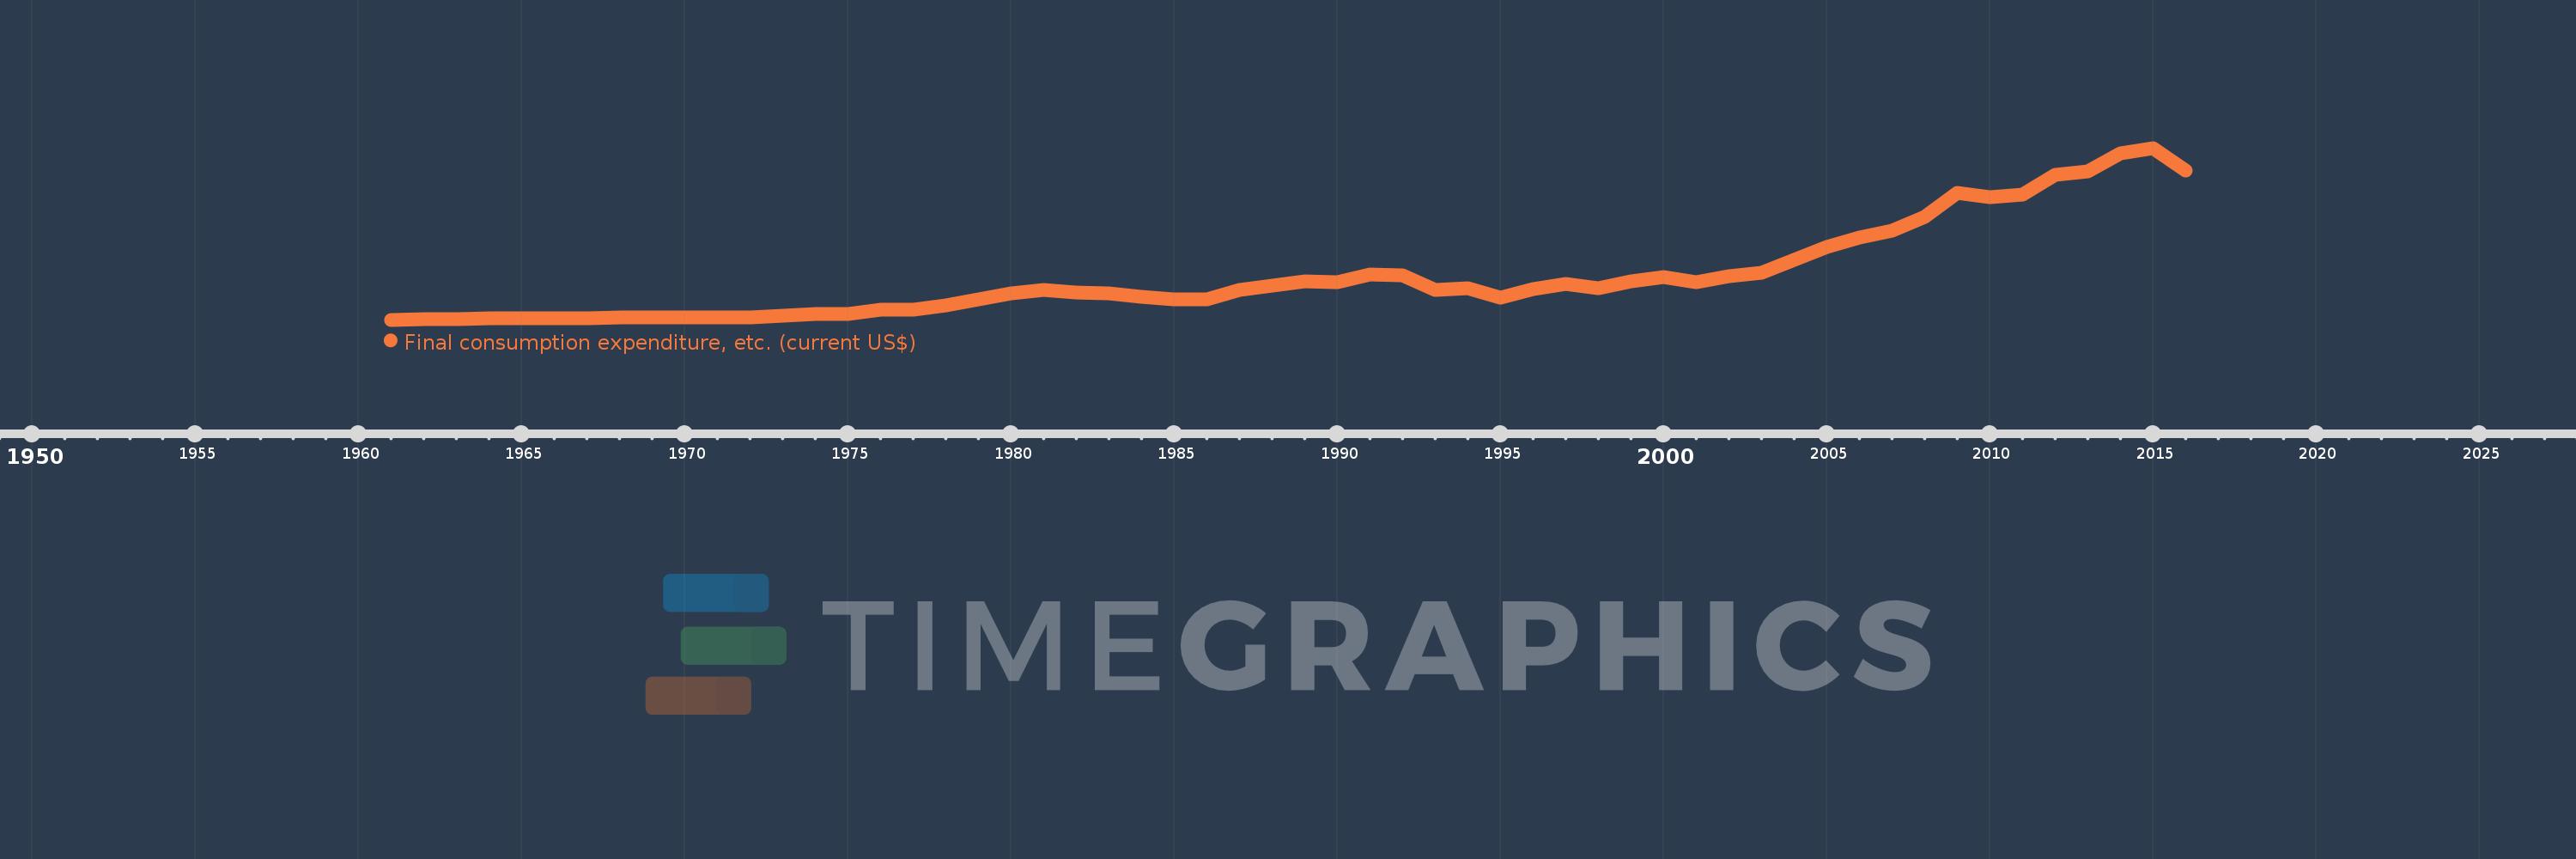
Final consumption expenditure, etc. (current US$)
2016,2015,2014,2013,2012,2011,2010,2009,2008,2007,2006,2005,2004,2003,2002,2001,2000,1999,1998,1997,1996,1995,1994,1993,1992,1991,1990,1989,1988,1987,1986,1985,1984,1983,1982,1981,1980,1979,1978,1977,1976,1975,1974,1973,1972,1971,1970,1969,1968,1967,1966,1965,1964,1963,1962,1961
This statistics in other country:
AfghanistanAlbaniaAlgeriaAngolaAntigua and BarbudaArab WorldArgentinaArmeniaArubaAustraliaAustriaAzerbaijanBahamas, TheBahrainBangladeshBarbadosBelarusBelgiumBelizeBeninBermudaBhutanBoliviaBosnia and HerzegovinaBotswanaBrazilBrunei DarussalamBulgariaBurkina FasoBurundiCabo VerdeCambodiaCameroonCanadaCaribbean small statesCentral African RepublicCentral Europe and the BalticsChadChileChinaColombiaComorosCongo, Dem. Rep.Congo, Rep.Costa RicaCote d'IvoireCroatiaCubaCyprusCzech RepublicDenmarkDjiboutiDominicaDominican RepublicEarly-demographic dividendEast Asia & PacificEast Asia & Pacific (excluding high income)East Asia & Pacific (IDA & IBRD countries)EcuadorEgypt, Arab Rep.El SalvadorEquatorial GuineaEritreaEstoniaEthiopiaEuro areaEurope & Central AsiaEurope & Central Asia (excluding high income)Europe & Central Asia (IDA & IBRD countries)European UnionFaroe IslandsFijiFinlandFragile and conflict affected situationsFranceGabonGambia, TheGeorgiaGermanyGhanaGreeceGrenadaGuatemalaGuineaGuinea-BissauGuyanaHaitiHeavily indebted poor countries (HIPC)High incomeHondurasHong Kong SAR, ChinaHungaryIBRD onlyIcelandIDA & IBRD totalIDA blendIDA onlyIDA totalIndiaIndonesiaIran, Islamic Rep.IraqIrelandIsraelItalyJamaicaJapanJordanKazakhstanKenyaKiribatiKorea, Rep.KosovoKuwaitKyrgyz RepublicLao PDRLate-demographic dividendLatin America & Caribbean Latin America & Caribbean (excluding high income)Latin America & the Caribbean (IDA & IBRD countries)LatviaLeast developed countries: UN classificationLebanonLesothoLiberiaLibyaLithuaniaLow & middle incomeLow incomeLower middle incomeLuxembourgMacao SAR, ChinaMacedonia, FYRMadagascarMalawiMalaysiaMaldivesMaliMaltaMauritaniaMauritiusMexicoMicronesia, Fed. Sts.Middle East & North AfricaMiddle East & North Africa (excluding high income)Middle East & North Africa (IDA & IBRD countries)Middle incomeMoldovaMongoliaMontenegroMoroccoMozambiqueNamibiaNepalNetherlandsNew CaledoniaNew ZealandNicaraguaNigerNigeriaNorth AmericaNorwayOECD membersOmanOther small statesPakistanPanamaPapua New GuineaParaguayPeruPhilippinesPolandPortugalPost-demographic dividendPre-demographic dividendPuerto RicoQatarRomaniaRussian FederationRwandaSaudi ArabiaSenegalSerbiaSeychellesSierra LeoneSingaporeSlovak RepublicSloveniaSmall statesSolomon IslandsSouth AfricaSouth AsiaSouth Asia (IDA & IBRD)South SudanSpainSri LankaSt. Kitts and NevisSt. LuciaSt. Vincent and the GrenadinesSub-Saharan Africa Sub-Saharan Africa (excluding high income)Sub-Saharan Africa (IDA & IBRD countries)SudanSurinameSwazilandSwedenSwitzerlandSyrian Arab RepublicTajikistanTanzaniaThailandTimor-LesteTogoTongaTrinidad and TobagoTunisiaTurkeyTurkmenistanUgandaUkraineUnited Arab EmiratesUnited KingdomUnited StatesUpper middle incomeUruguayUzbekistanVanuatuVenezuela, RBVietnamWest Bank and GazaWorldYemen, Rep.ZambiaZimbabwe Timeline:
This timeline shows a graph from 1961 to 2016 of Burkina Faso. No data until 1960. Number of actual observations by date: 56.
Source name:
World Development Indicators
Source organization:
World Bank national accounts data, and OECD National Accounts data files.
Categories, topics:
Economy & Growth
Last updated:
apr 23, 2017
Indicators value changes by year
Minimum:
338.563 mln
jan 1, 1961
Maximum:
10.167 bln
jan 1, 2015
At the date of observation
Value
Absolute change
Change from previous value
jan 1, 1961
338.563 mln
+338.563 mln
0.0%
jan 1, 1962
356.225 mln
+17.662 mln
5.22%
jan 1, 1963
385.132 mln
+28.907 mln
8.11%
jan 1, 1964
399.117 mln
+13.985 mln
3.63%
jan 1, 1965
406.549 mln
+7.432 mln
1.86%
jan 1, 1966
414.51 mln
+7.961 mln
1.96%
jan 1, 1967
427.922 mln
+13.413 mln
3.24%
jan 1, 1968
455.154 mln
+27.231 mln
6.36%
jan 1, 1969
464.184 mln
+9.03 mln
1.98%
jan 1, 1970
483.583 mln
+19.4 mln
4.18%
jan 1, 1971
460.314 mln
-23.27 mln
-4.81%
jan 1, 1972
480.22 mln
+19.906 mln
4.32%
jan 1, 1973
564.777 mln
+84.558 mln
17.61%
jan 1, 1974
647.625 mln
+82.848 mln
14.67%
jan 1, 1975
680.745 mln
+33.119 mln
5.11%
jan 1, 1976
937.14 mln
+256.395 mln
37.66%
jan 1, 1977
937.08 mln
-59.727K
-0.01%
jan 1, 1978
1.164 bln
+227.183 mln
24.24%
jan 1, 1979
1.505 bln
+340.294 mln
29.23%
jan 1, 1980
1.83 bln
+324.988 mln
21.6%
jan 1, 1981
2.068 bln
+238.141 mln
13.02%
jan 1, 1982
1.918 bln
-149.282 mln
-7.22%
jan 1, 1983
1.851 bln
-67.429 mln
-3.51%
jan 1, 1984
1.673 bln
-177.76 mln
-9.6%
jan 1, 1985
1.513 bln
-160.338 mln
-9.58%
jan 1, 1986
1.524 bln
+10.915 mln
0.72%
jan 1, 1987
2.033 bln
+509.334 mln
33.43%
jan 1, 1988
2.311 bln
+277.454 mln
13.65%
jan 1, 1989
2.547 bln
+235.961 mln
10.21%
jan 1, 1990
2.471 bln
-75.151 mln
-2.95%
jan 1, 1991
2.933 bln
+461.692 mln
18.68%
jan 1, 1992
2.873 bln
-59.64 mln
-2.03%
jan 1, 1993
2.047 bln
-826.32 mln
-28.76%
jan 1, 1994
2.152 bln
+104.457 mln
5.1%
jan 1, 1995
1.586 bln
-565.983 mln
-26.31%
jan 1, 1996
2.107 bln
+521.253 mln
32.87%
jan 1, 1997
2.382 bln
+275.581 mln
13.08%
jan 1, 1998
2.164 bln
-218.701 mln
-9.18%
jan 1, 1999
2.557 bln
+392.912 mln
18.16%
jan 1, 2000
2.766 bln
+209.022 mln
8.18%
jan 1, 2001
2.507 bln
-258.231 mln
-9.34%
jan 1, 2002
2.815 bln
+307.732 mln
12.27%
jan 1, 2003
3.047 bln
+231.672 mln
8.23%
jan 1, 2004
3.771 bln
+724.161 mln
23.77%
jan 1, 2005
4.492 bln
+720.824 mln
19.11%
jan 1, 2006
5.019 bln
+527.233 mln
11.74%
jan 1, 2007
5.443 bln
+423.651 mln
8.44%
jan 1, 2008
6.241 bln
+798.272 mln
14.67%
jan 1, 2009
7.613 bln
+1.372 bln
21.99%
jan 1, 2010
7.346 bln
-267.88 mln
-3.52%
jan 1, 2011
7.504 bln
+158.401 mln
2.16%
jan 1, 2012
8.616 bln
+1.112 bln
14.82%
jan 1, 2013
8.843 bln
+226.717 mln
2.63%
jan 1, 2014
9.846 bln
+1.003 bln
11.34%
jan 1, 2015
10.167 bln
+321.951 mln
3.27%
jan 1, 2016
8.894 bln
-1.274 bln
-12.53%
Ranking of countries by current statistics by years


Comments: