29
/
en
AIzaSyAYiBZKx7MnpbEhh9jyipgxe19OcubqV5w
April 1, 2024
210330
Nicaragua
NIC
true
2
1
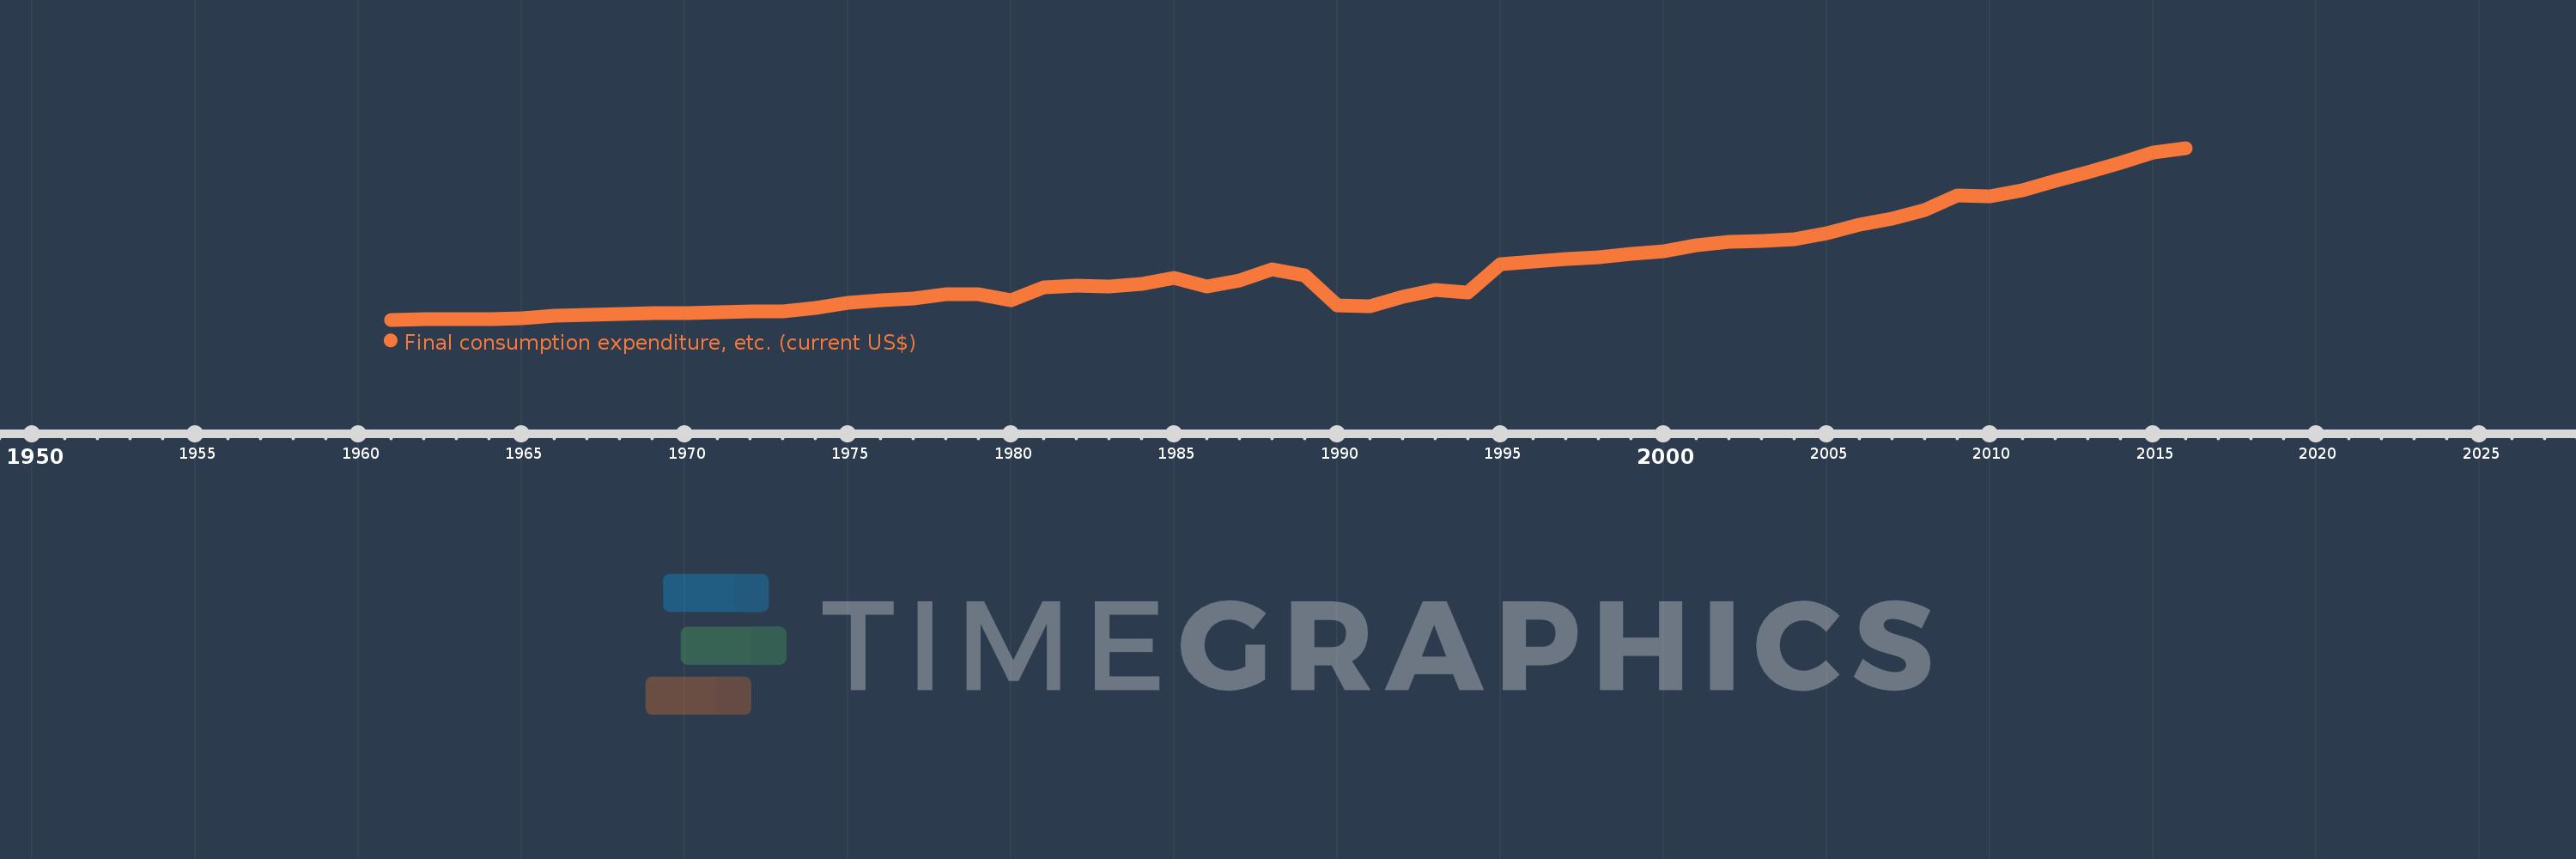
Final consumption expenditure, etc. (current US$)
2016,2015,2014,2013,2012,2011,2010,2009,2008,2007,2006,2005,2004,2003,2002,2001,2000,1999,1998,1997,1996,1995,1994,1993,1992,1991,1990,1989,1988,1987,1986,1985,1984,1983,1982,1981,1980,1979,1978,1977,1976,1975,1974,1973,1972,1971,1970,1969,1968,1967,1966,1965,1964,1963,1962,1961
This statistics in other country:
AfghanistanAlbaniaAlgeriaAngolaAntigua and BarbudaArab WorldArgentinaArmeniaArubaAustraliaAustriaAzerbaijanBahamas, TheBahrainBangladeshBarbadosBelarusBelgiumBelizeBeninBermudaBhutanBoliviaBosnia and HerzegovinaBotswanaBrazilBrunei DarussalamBulgariaBurkina FasoBurundiCabo VerdeCambodiaCameroonCanadaCaribbean small statesCentral African RepublicCentral Europe and the BalticsChadChileChinaColombiaComorosCongo, Dem. Rep.Congo, Rep.Costa RicaCote d'IvoireCroatiaCubaCyprusCzech RepublicDenmarkDjiboutiDominicaDominican RepublicEarly-demographic dividendEast Asia & PacificEast Asia & Pacific (excluding high income)East Asia & Pacific (IDA & IBRD countries)EcuadorEgypt, Arab Rep.El SalvadorEquatorial GuineaEritreaEstoniaEthiopiaEuro areaEurope & Central AsiaEurope & Central Asia (excluding high income)Europe & Central Asia (IDA & IBRD countries)European UnionFaroe IslandsFijiFinlandFragile and conflict affected situationsFranceGabonGambia, TheGeorgiaGermanyGhanaGreeceGrenadaGuatemalaGuineaGuinea-BissauGuyanaHaitiHeavily indebted poor countries (HIPC)High incomeHondurasHong Kong SAR, ChinaHungaryIBRD onlyIcelandIDA & IBRD totalIDA blendIDA onlyIDA totalIndiaIndonesiaIran, Islamic Rep.IraqIrelandIsraelItalyJamaicaJapanJordanKazakhstanKenyaKiribatiKorea, Rep.KosovoKuwaitKyrgyz RepublicLao PDRLate-demographic dividendLatin America & Caribbean Latin America & Caribbean (excluding high income)Latin America & the Caribbean (IDA & IBRD countries)LatviaLeast developed countries: UN classificationLebanonLesothoLiberiaLibyaLithuaniaLow & middle incomeLow incomeLower middle incomeLuxembourgMacao SAR, ChinaMacedonia, FYRMadagascarMalawiMalaysiaMaldivesMaliMaltaMauritaniaMauritiusMexicoMicronesia, Fed. Sts.Middle East & North AfricaMiddle East & North Africa (excluding high income)Middle East & North Africa (IDA & IBRD countries)Middle incomeMoldovaMongoliaMontenegroMoroccoMozambiqueNamibiaNepalNetherlandsNew CaledoniaNew ZealandNicaraguaNigerNigeriaNorth AmericaNorwayOECD membersOmanOther small statesPakistanPanamaPapua New GuineaParaguayPeruPhilippinesPolandPortugalPost-demographic dividendPre-demographic dividendPuerto RicoQatarRomaniaRussian FederationRwandaSaudi ArabiaSenegalSerbiaSeychellesSierra LeoneSingaporeSlovak RepublicSloveniaSmall statesSolomon IslandsSouth AfricaSouth AsiaSouth Asia (IDA & IBRD)South SudanSpainSri LankaSt. Kitts and NevisSt. LuciaSt. Vincent and the GrenadinesSub-Saharan Africa Sub-Saharan Africa (excluding high income)Sub-Saharan Africa (IDA & IBRD countries)SudanSurinameSwazilandSwedenSwitzerlandSyrian Arab RepublicTajikistanTanzaniaThailandTimor-LesteTogoTongaTrinidad and TobagoTunisiaTurkeyTurkmenistanUgandaUkraineUnited Arab EmiratesUnited KingdomUnited StatesUpper middle incomeUruguayUzbekistanVanuatuVenezuela, RBVietnamWest Bank and GazaWorldYemen, Rep.ZambiaZimbabwe Timeline:
This timeline shows a graph from 1961 to 2016 of Nicaragua. No data until 1960. Number of actual observations by date: 56.
Source name:
World Development Indicators
Source organization:
World Bank national accounts data, and OECD National Accounts data files.
Categories, topics:
Economy & Growth
Last updated:
apr 23, 2017
Indicators value changes by year
Minimum:
196.17 mln
jan 1, 1961
Maximum:
10.926 bln
jan 1, 2016
At the date of observation
Value
Absolute change
Change from previous value
jan 1, 1961
196.17 mln
+196.17 mln
0.0%
jan 1, 1962
207.597 mln
+11.427 mln
5.83%
jan 1, 1963
226.157 mln
+18.56 mln
8.94%
jan 1, 1964
246.143 mln
+19.985 mln
8.84%
jan 1, 1965
280.424 mln
+34.281 mln
13.93%
jan 1, 1966
465.629 mln
+185.205 mln
66.04%
jan 1, 1967
509.7 mln
+44.071 mln
9.46%
jan 1, 1968
575.614 mln
+65.914 mln
12.93%
jan 1, 1969
598.271 mln
+22.657 mln
3.94%
jan 1, 1970
626.986 mln
+28.714 mln
4.8%
jan 1, 1971
651.286 mln
+24.3 mln
3.88%
jan 1, 1972
698.657 mln
+47.371 mln
7.27%
jan 1, 1973
717.929 mln
+19.271 mln
2.76%
jan 1, 1974
936.214 mln
+218.286 mln
30.4%
jan 1, 1975
1.248 bln
+311.457 mln
33.27%
jan 1, 1976
1.391 bln
+143.6 mln
11.51%
jan 1, 1977
1.506 bln
+115.229 mln
8.28%
jan 1, 1978
1.785 bln
+278.886 mln
18.51%
jan 1, 1979
1.81 bln
+24.714 mln
1.38%
jan 1, 1980
1.403 bln
-406.805 mln
-22.47%
jan 1, 1981
2.239 bln
+835.547 mln
59.54%
jan 1, 1982
2.347 bln
+107.668 mln
4.81%
jan 1, 1983
2.251 bln
-95.841 mln
-4.08%
jan 1, 1984
2.417 bln
+166.505 mln
7.4%
jan 1, 1985
2.819 bln
+401.99 mln
16.63%
jan 1, 1986
2.252 bln
-566.868 mln
-20.11%
jan 1, 1987
2.631 bln
+378.388 mln
16.8%
jan 1, 1988
3.319 bln
+688.713 mln
26.18%
jan 1, 1989
2.987 bln
-332.316 mln
-10.01%
jan 1, 1990
1.066 bln
-1.921 bln
-64.32%
jan 1, 1991
1.031 bln
-34.961 mln
-3.28%
jan 1, 1992
1.636 bln
+605.471 mln
58.74%
jan 1, 1993
2.063 bln
+427.031 mln
26.1%
jan 1, 1994
1.896 bln
-167.0 mln
-8.09%
jan 1, 1995
3.68 bln
+1.784 bln
94.08%
jan 1, 1996
3.847 bln
+166.885 mln
4.53%
jan 1, 1997
3.99 bln
+142.675 mln
3.71%
jan 1, 1998
4.077 bln
+87.415 mln
2.19%
jan 1, 1999
4.289 bln
+211.131 mln
5.18%
jan 1, 2000
4.49 bln
+201.728 mln
4.7%
jan 1, 2001
4.823 bln
+332.423 mln
7.4%
jan 1, 2002
5.088 bln
+265.645 mln
5.51%
jan 1, 2003
5.118 bln
+29.521 mln
0.58%
jan 1, 2004
5.243 bln
+125.508 mln
2.45%
jan 1, 2005
5.62 bln
+376.257 mln
7.18%
jan 1, 2006
6.131 bln
+511.809 mln
9.11%
jan 1, 2007
6.53 bln
+398.103 mln
6.49%
jan 1, 2008
7.073 bln
+542.962 mln
8.32%
jan 1, 2009
7.985 bln
+912.935 mln
12.91%
jan 1, 2010
7.892 bln
-93.607 mln
-1.17%
jan 1, 2011
8.296 bln
+403.733 mln
5.12%
jan 1, 2012
8.872 bln
+576.185 mln
6.95%
jan 1, 2013
9.381 bln
+509.327 mln
5.74%
jan 1, 2014
9.977 bln
+595.477 mln
6.35%
jan 1, 2015
10.634 bln
+657.633 mln
6.59%
jan 1, 2016
10.926 bln
+291.723 mln
2.74%
Ranking of countries by current statistics by years


Comments: