29
/
en
AIzaSyAYiBZKx7MnpbEhh9jyipgxe19OcubqV5w
April 1, 2024
212921
Nigeria
NGA
true
2
1
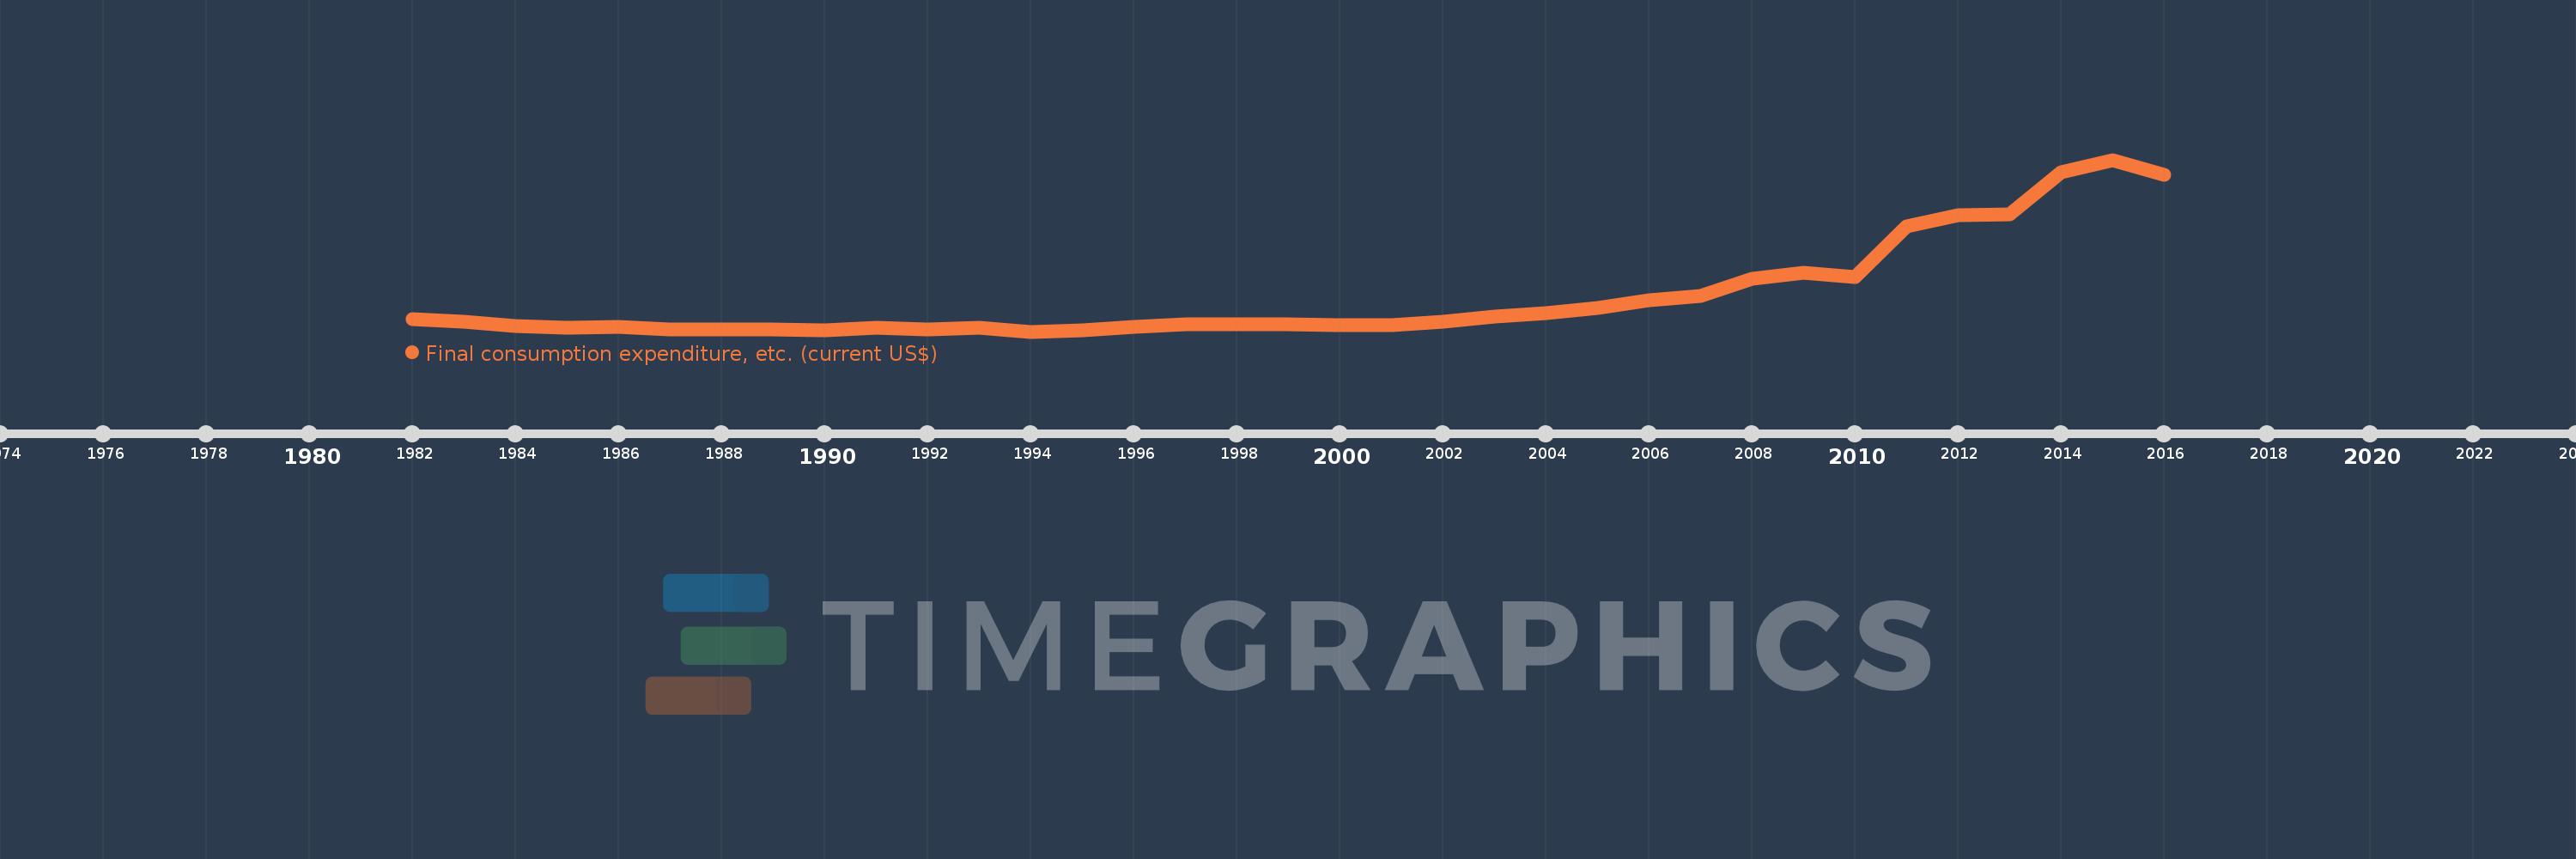
Final consumption expenditure, etc. (current US$)
2016,2015,2014,2013,2012,2011,2010,2009,2008,2007,2006,2005,2004,2003,2002,2001,2000,1999,1998,1997,1996,1995,1994,1993,1992,1991,1990,1989,1988,1987,1986,1985,1984,1983,1982
This statistics in other country:
AfghanistanAlbaniaAlgeriaAngolaAntigua and BarbudaArab WorldArgentinaArmeniaArubaAustraliaAustriaAzerbaijanBahamas, TheBahrainBangladeshBarbadosBelarusBelgiumBelizeBeninBermudaBhutanBoliviaBosnia and HerzegovinaBotswanaBrazilBrunei DarussalamBulgariaBurkina FasoBurundiCabo VerdeCambodiaCameroonCanadaCaribbean small statesCentral African RepublicCentral Europe and the BalticsChadChileChinaColombiaComorosCongo, Dem. Rep.Congo, Rep.Costa RicaCote d'IvoireCroatiaCubaCyprusCzech RepublicDenmarkDjiboutiDominicaDominican RepublicEarly-demographic dividendEast Asia & PacificEast Asia & Pacific (excluding high income)East Asia & Pacific (IDA & IBRD countries)EcuadorEgypt, Arab Rep.El SalvadorEquatorial GuineaEritreaEstoniaEthiopiaEuro areaEurope & Central AsiaEurope & Central Asia (excluding high income)Europe & Central Asia (IDA & IBRD countries)European UnionFaroe IslandsFijiFinlandFragile and conflict affected situationsFranceGabonGambia, TheGeorgiaGermanyGhanaGreeceGrenadaGuatemalaGuineaGuinea-BissauGuyanaHaitiHeavily indebted poor countries (HIPC)High incomeHondurasHong Kong SAR, ChinaHungaryIBRD onlyIcelandIDA & IBRD totalIDA blendIDA onlyIDA totalIndiaIndonesiaIran, Islamic Rep.IraqIrelandIsraelItalyJamaicaJapanJordanKazakhstanKenyaKiribatiKorea, Rep.KosovoKuwaitKyrgyz RepublicLao PDRLate-demographic dividendLatin America & Caribbean Latin America & Caribbean (excluding high income)Latin America & the Caribbean (IDA & IBRD countries)LatviaLeast developed countries: UN classificationLebanonLesothoLiberiaLibyaLithuaniaLow & middle incomeLow incomeLower middle incomeLuxembourgMacao SAR, ChinaMacedonia, FYRMadagascarMalawiMalaysiaMaldivesMaliMaltaMauritaniaMauritiusMexicoMicronesia, Fed. Sts.Middle East & North AfricaMiddle East & North Africa (excluding high income)Middle East & North Africa (IDA & IBRD countries)Middle incomeMoldovaMongoliaMontenegroMoroccoMozambiqueNamibiaNepalNetherlandsNew CaledoniaNew ZealandNicaraguaNigerNigeriaNorth AmericaNorwayOECD membersOmanOther small statesPakistanPanamaPapua New GuineaParaguayPeruPhilippinesPolandPortugalPost-demographic dividendPre-demographic dividendPuerto RicoQatarRomaniaRussian FederationRwandaSaudi ArabiaSenegalSerbiaSeychellesSierra LeoneSingaporeSlovak RepublicSloveniaSmall statesSolomon IslandsSouth AfricaSouth AsiaSouth Asia (IDA & IBRD)South SudanSpainSri LankaSt. Kitts and NevisSt. LuciaSt. Vincent and the GrenadinesSub-Saharan Africa Sub-Saharan Africa (excluding high income)Sub-Saharan Africa (IDA & IBRD countries)SudanSurinameSwazilandSwedenSwitzerlandSyrian Arab RepublicTajikistanTanzaniaThailandTimor-LesteTogoTongaTrinidad and TobagoTunisiaTurkeyTurkmenistanUgandaUkraineUnited Arab EmiratesUnited KingdomUnited StatesUpper middle incomeUruguayUzbekistanVanuatuVenezuela, RBVietnamWest Bank and GazaWorldYemen, Rep.ZambiaZimbabwe Timeline:
This timeline shows a graph from 1982 to 2016 of Nigeria. No data until 1981. Number of actual observations by date: 35.
Source name:
World Development Indicators
Source organization:
World Bank national accounts data, and OECD National Accounts data files.
Categories, topics:
Economy & Growth
Last updated:
apr 23, 2017
Indicators value changes by year
Minimum:
12.132 bln
jan 1, 1994
Maximum:
444.636 bln
jan 1, 2015
At the date of observation
Value
Absolute change
Change from previous value
jan 1, 1982
42.691 bln
+42.691 bln
0.0%
jan 1, 1983
37.182 bln
-5.509 bln
-12.9%
jan 1, 1984
26.975 bln
-10.207 bln
-27.45%
jan 1, 1985
22.737 bln
-4.238 bln
-15.71%
jan 1, 1986
23.033 bln
+296.22 mln
1.3%
jan 1, 1987
16.864 bln
-6.17 bln
-26.79%
jan 1, 1988
18.094 bln
+1.23 bln
7.29%
jan 1, 1989
18.561 bln
+466.817 mln
2.58%
jan 1, 1990
14.704 bln
-3.857 bln
-20.78%
jan 1, 1991
20.888 bln
+6.184 bln
42.06%
jan 1, 1992
18.54 bln
-2.349 bln
-11.24%
jan 1, 1993
21.451 bln
+2.911 bln
15.7%
jan 1, 1994
12.132 bln
-9.319 bln
-43.44%
jan 1, 1995
14.92 bln
+2.788 bln
22.98%
jan 1, 1996
23.169 bln
+8.249 bln
55.29%
jan 1, 1997
30.058 bln
+6.889 bln
29.73%
jan 1, 1998
30.427 bln
+368.818 mln
1.23%
jan 1, 1999
31.419 bln
+992.023 mln
3.26%
jan 1, 2000
29.09 bln
-2.329 bln
-7.41%
jan 1, 2001
28.244 bln
-845.838 mln
-2.91%
jan 1, 2002
36.777 bln
+8.533 bln
30.21%
jan 1, 2003
49.914 bln
+13.136 bln
35.72%
jan 1, 2004
58.001 bln
+8.088 bln
16.2%
jan 1, 2005
70.913 bln
+12.912 bln
22.26%
jan 1, 2006
92.007 bln
+21.094 bln
29.75%
jan 1, 2007
101.965 bln
+9.958 bln
10.82%
jan 1, 2008
146.06 bln
+44.095 bln
43.25%
jan 1, 2009
159.954 bln
+13.894 bln
9.51%
jan 1, 2010
149.433 bln
-10.52 bln
-6.58%
jan 1, 2011
276.178 bln
+126.745 bln
84.82%
jan 1, 2012
304.371 bln
+28.193 bln
10.21%
jan 1, 2013
306.972 bln
+2.601 bln
0.85%
jan 1, 2014
412.205 bln
+105.234 bln
34.28%
jan 1, 2015
444.636 bln
+32.43 bln
7.87%
jan 1, 2016
407.191 bln
-37.445 bln
-8.42%
Ranking of countries by current statistics by years


Comments: