29
/
en
AIzaSyAYiBZKx7MnpbEhh9jyipgxe19OcubqV5w
April 1, 2024
77087
Bahrain
BHR
true
2
1
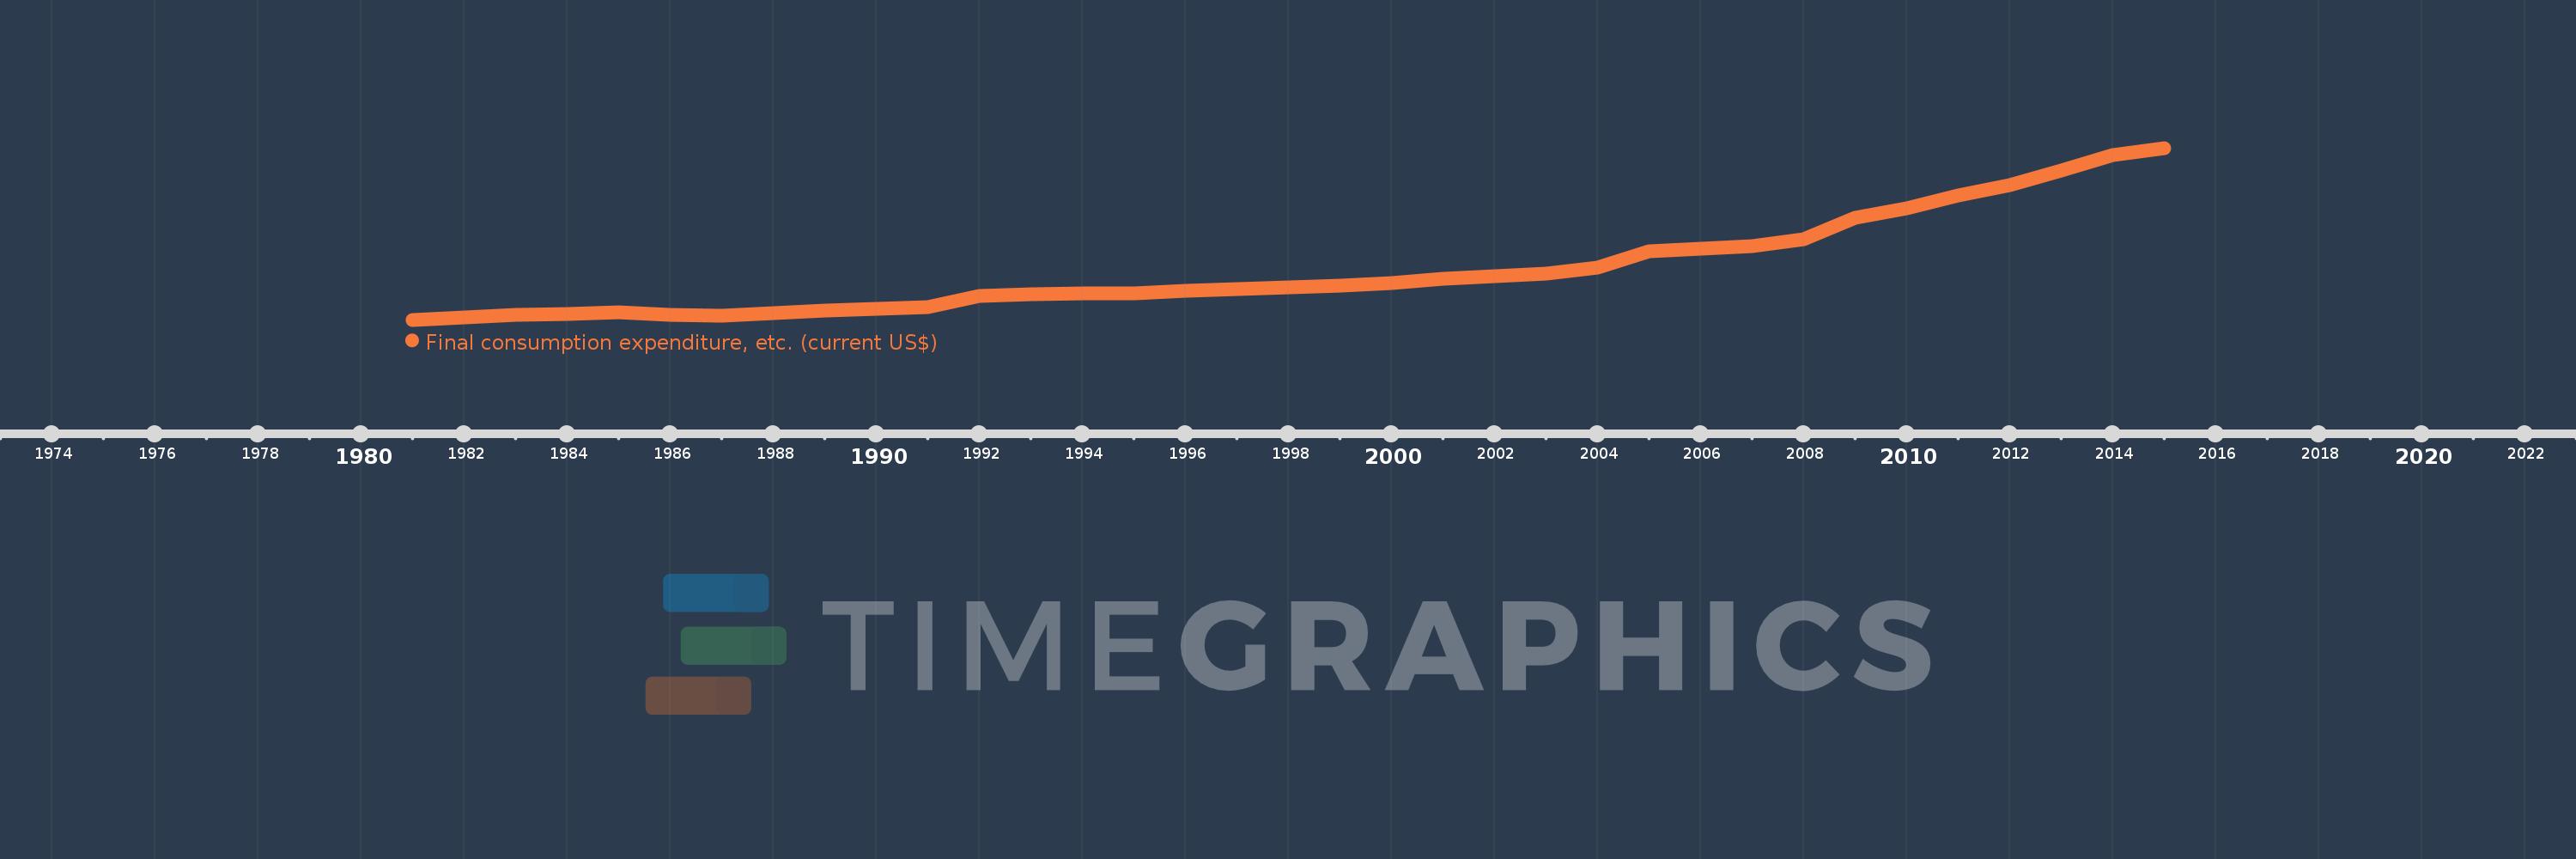
Final consumption expenditure, etc. (current US$)
2015,2014,2013,2012,2011,2010,2009,2008,2007,2006,2005,2004,2003,2002,2001,2000,1999,1998,1997,1996,1995,1994,1993,1992,1991,1990,1989,1988,1987,1986,1985,1984,1983,1982,1981
This statistics in other country:
AfghanistanAlbaniaAlgeriaAngolaAntigua and BarbudaArab WorldArgentinaArmeniaArubaAustraliaAustriaAzerbaijanBahamas, TheBahrainBangladeshBarbadosBelarusBelgiumBelizeBeninBermudaBhutanBoliviaBosnia and HerzegovinaBotswanaBrazilBrunei DarussalamBulgariaBurkina FasoBurundiCabo VerdeCambodiaCameroonCanadaCaribbean small statesCentral African RepublicCentral Europe and the BalticsChadChileChinaColombiaComorosCongo, Dem. Rep.Congo, Rep.Costa RicaCote d'IvoireCroatiaCubaCyprusCzech RepublicDenmarkDjiboutiDominicaDominican RepublicEarly-demographic dividendEast Asia & PacificEast Asia & Pacific (excluding high income)East Asia & Pacific (IDA & IBRD countries)EcuadorEgypt, Arab Rep.El SalvadorEquatorial GuineaEritreaEstoniaEthiopiaEuro areaEurope & Central AsiaEurope & Central Asia (excluding high income)Europe & Central Asia (IDA & IBRD countries)European UnionFaroe IslandsFijiFinlandFragile and conflict affected situationsFranceGabonGambia, TheGeorgiaGermanyGhanaGreeceGrenadaGuatemalaGuineaGuinea-BissauGuyanaHaitiHeavily indebted poor countries (HIPC)High incomeHondurasHong Kong SAR, ChinaHungaryIBRD onlyIcelandIDA & IBRD totalIDA blendIDA onlyIDA totalIndiaIndonesiaIran, Islamic Rep.IraqIrelandIsraelItalyJamaicaJapanJordanKazakhstanKenyaKiribatiKorea, Rep.KosovoKuwaitKyrgyz RepublicLao PDRLate-demographic dividendLatin America & Caribbean Latin America & Caribbean (excluding high income)Latin America & the Caribbean (IDA & IBRD countries)LatviaLeast developed countries: UN classificationLebanonLesothoLiberiaLibyaLithuaniaLow & middle incomeLow incomeLower middle incomeLuxembourgMacao SAR, ChinaMacedonia, FYRMadagascarMalawiMalaysiaMaldivesMaliMaltaMauritaniaMauritiusMexicoMicronesia, Fed. Sts.Middle East & North AfricaMiddle East & North Africa (excluding high income)Middle East & North Africa (IDA & IBRD countries)Middle incomeMoldovaMongoliaMontenegroMoroccoMozambiqueNamibiaNepalNetherlandsNew CaledoniaNew ZealandNicaraguaNigerNigeriaNorth AmericaNorwayOECD membersOmanOther small statesPakistanPanamaPapua New GuineaParaguayPeruPhilippinesPolandPortugalPost-demographic dividendPre-demographic dividendPuerto RicoQatarRomaniaRussian FederationRwandaSaudi ArabiaSenegalSerbiaSeychellesSierra LeoneSingaporeSlovak RepublicSloveniaSmall statesSolomon IslandsSouth AfricaSouth AsiaSouth Asia (IDA & IBRD)South SudanSpainSri LankaSt. Kitts and NevisSt. LuciaSt. Vincent and the GrenadinesSub-Saharan Africa Sub-Saharan Africa (excluding high income)Sub-Saharan Africa (IDA & IBRD countries)SudanSurinameSwazilandSwedenSwitzerlandSyrian Arab RepublicTajikistanTanzaniaThailandTimor-LesteTogoTongaTrinidad and TobagoTunisiaTurkeyTurkmenistanUgandaUkraineUnited Arab EmiratesUnited KingdomUnited StatesUpper middle incomeUruguayUzbekistanVanuatuVenezuela, RBVietnamWest Bank and GazaWorldYemen, Rep.ZambiaZimbabwe Timeline:
This timeline shows a graph from 1981 to 2015 of Bahrain. No data until 1980. Number of actual observations by date: 35.
Source name:
World Development Indicators
Source organization:
World Bank national accounts data, and OECD National Accounts data files.
Categories, topics:
Economy & Growth
Last updated:
apr 23, 2017
Indicators value changes by year
Minimum:
1.383 bln
jan 1, 1981
Maximum:
18.716 bln
jan 1, 2015
At the date of observation
Value
Absolute change
Change from previous value
jan 1, 1981
1.383 bln
+1.383 bln
0.0%
jan 1, 1982
1.639 bln
+256.236 mln
18.53%
jan 1, 1983
1.878 bln
+239.096 mln
14.59%
jan 1, 1984
1.958 bln
+79.522 mln
4.23%
jan 1, 1985
2.139 bln
+181.648 mln
9.28%
jan 1, 1986
1.914 bln
-225.0 mln
-10.52%
jan 1, 1987
1.815 bln
-98.936 mln
-5.17%
jan 1, 1988
2.021 bln
+205.319 mln
11.31%
jan 1, 1989
2.294 bln
+273.139 mln
13.52%
jan 1, 1990
2.486 bln
+192.287 mln
8.38%
jan 1, 1991
2.649 bln
+162.501 mln
6.54%
jan 1, 1992
3.787 bln
+1.138 bln
42.98%
jan 1, 1993
3.941 bln
+153.723 mln
4.06%
jan 1, 1994
4.085 bln
+144.149 mln
3.66%
jan 1, 1995
4.073 bln
-11.702 mln
-0.29%
jan 1, 1996
4.321 bln
+248.138 mln
6.09%
jan 1, 1997
4.508 bln
+186.968 mln
4.33%
jan 1, 1998
4.634 bln
+125.532 mln
2.78%
jan 1, 1999
4.815 bln
+180.851 mln
3.9%
jan 1, 2000
5.045 bln
+230.053 mln
4.78%
jan 1, 2001
5.517 bln
+472.164 mln
9.36%
jan 1, 2002
5.753 bln
+236.478 mln
4.29%
jan 1, 2003
6.06 bln
+307.044 mln
5.34%
jan 1, 2004
6.67 bln
+609.952 mln
10.06%
jan 1, 2005
8.286 bln
+1.615 bln
24.21%
jan 1, 2006
8.59 bln
+304.072 mln
3.67%
jan 1, 2007
8.779 bln
+189.044 mln
2.2%
jan 1, 2008
9.499 bln
+720.133 mln
8.2%
jan 1, 2009
11.713 bln
+2.214 bln
23.31%
jan 1, 2010
12.591 bln
+877.606 mln
7.49%
jan 1, 2011
13.914 bln
+1.323 bln
10.51%
jan 1, 2012
14.97 bln
+1.056 bln
7.59%
jan 1, 2013
16.427 bln
+1.457 bln
9.73%
jan 1, 2014
17.962 bln
+1.534 bln
9.34%
jan 1, 2015
18.716 bln
+753.883 mln
4.2%
Ranking of countries by current statistics by years


Comments: