29
/
en
AIzaSyAYiBZKx7MnpbEhh9jyipgxe19OcubqV5w
April 1, 2024
267945
Tunisia
TUN
true
2
1
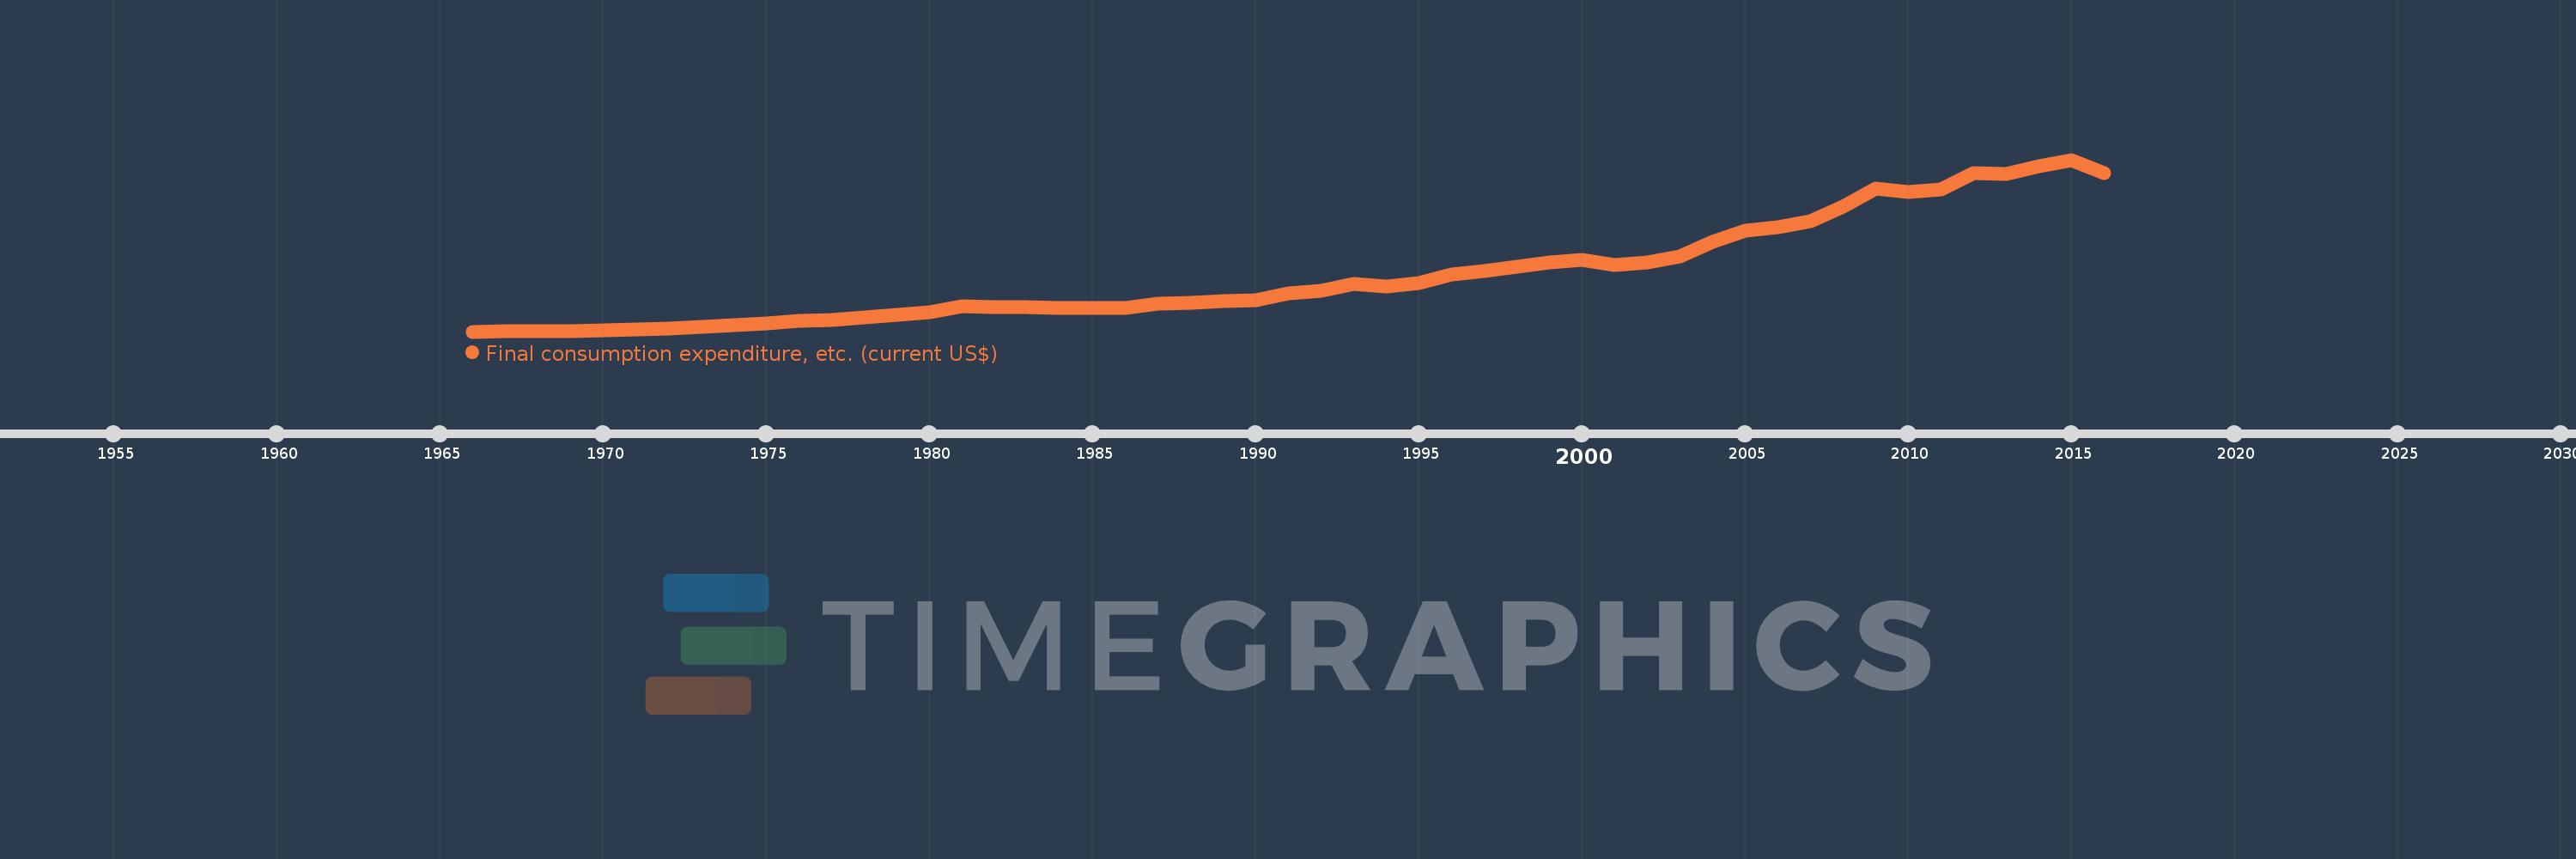
Final consumption expenditure, etc. (current US$)
2016,2015,2014,2013,2012,2011,2010,2009,2008,2007,2006,2005,2004,2003,2002,2001,2000,1999,1998,1997,1996,1995,1994,1993,1992,1991,1990,1989,1988,1987,1986,1985,1984,1983,1982,1981,1980,1979,1978,1977,1976,1975,1974,1973,1972,1971,1970,1969,1968,1967,1966
This statistics in other country:
AfghanistanAlbaniaAlgeriaAngolaAntigua and BarbudaArab WorldArgentinaArmeniaArubaAustraliaAustriaAzerbaijanBahamas, TheBahrainBangladeshBarbadosBelarusBelgiumBelizeBeninBermudaBhutanBoliviaBosnia and HerzegovinaBotswanaBrazilBrunei DarussalamBulgariaBurkina FasoBurundiCabo VerdeCambodiaCameroonCanadaCaribbean small statesCentral African RepublicCentral Europe and the BalticsChadChileChinaColombiaComorosCongo, Dem. Rep.Congo, Rep.Costa RicaCote d'IvoireCroatiaCubaCyprusCzech RepublicDenmarkDjiboutiDominicaDominican RepublicEarly-demographic dividendEast Asia & PacificEast Asia & Pacific (excluding high income)East Asia & Pacific (IDA & IBRD countries)EcuadorEgypt, Arab Rep.El SalvadorEquatorial GuineaEritreaEstoniaEthiopiaEuro areaEurope & Central AsiaEurope & Central Asia (excluding high income)Europe & Central Asia (IDA & IBRD countries)European UnionFaroe IslandsFijiFinlandFragile and conflict affected situationsFranceGabonGambia, TheGeorgiaGermanyGhanaGreeceGrenadaGuatemalaGuineaGuinea-BissauGuyanaHaitiHeavily indebted poor countries (HIPC)High incomeHondurasHong Kong SAR, ChinaHungaryIBRD onlyIcelandIDA & IBRD totalIDA blendIDA onlyIDA totalIndiaIndonesiaIran, Islamic Rep.IraqIrelandIsraelItalyJamaicaJapanJordanKazakhstanKenyaKiribatiKorea, Rep.KosovoKuwaitKyrgyz RepublicLao PDRLate-demographic dividendLatin America & Caribbean Latin America & Caribbean (excluding high income)Latin America & the Caribbean (IDA & IBRD countries)LatviaLeast developed countries: UN classificationLebanonLesothoLiberiaLibyaLithuaniaLow & middle incomeLow incomeLower middle incomeLuxembourgMacao SAR, ChinaMacedonia, FYRMadagascarMalawiMalaysiaMaldivesMaliMaltaMauritaniaMauritiusMexicoMicronesia, Fed. Sts.Middle East & North AfricaMiddle East & North Africa (excluding high income)Middle East & North Africa (IDA & IBRD countries)Middle incomeMoldovaMongoliaMontenegroMoroccoMozambiqueNamibiaNepalNetherlandsNew CaledoniaNew ZealandNicaraguaNigerNigeriaNorth AmericaNorwayOECD membersOmanOther small statesPakistanPanamaPapua New GuineaParaguayPeruPhilippinesPolandPortugalPost-demographic dividendPre-demographic dividendPuerto RicoQatarRomaniaRussian FederationRwandaSaudi ArabiaSenegalSerbiaSeychellesSierra LeoneSingaporeSlovak RepublicSloveniaSmall statesSolomon IslandsSouth AfricaSouth AsiaSouth Asia (IDA & IBRD)South SudanSpainSri LankaSt. Kitts and NevisSt. LuciaSt. Vincent and the GrenadinesSub-Saharan Africa Sub-Saharan Africa (excluding high income)Sub-Saharan Africa (IDA & IBRD countries)SudanSurinameSwazilandSwedenSwitzerlandSyrian Arab RepublicTajikistanTanzaniaThailandTimor-LesteTogoTongaTrinidad and TobagoTunisiaTurkeyTurkmenistanUgandaUkraineUnited Arab EmiratesUnited KingdomUnited StatesUpper middle incomeUruguayUzbekistanVanuatuVenezuela, RBVietnamWest Bank and GazaWorldYemen, Rep.ZambiaZimbabwe Timeline:
This timeline shows a graph from 1966 to 2016 of Tunisia. No data until 1965. Number of actual observations by date: 51.
Source name:
World Development Indicators
Source organization:
World Bank national accounts data, and OECD National Accounts data files.
Categories, topics:
Economy & Growth
Last updated:
apr 23, 2017
Indicators value changes by year
Minimum:
668.381 mln
jan 1, 1966
Maximum:
41.504 bln
jan 1, 2015
At the date of observation
Value
Absolute change
Change from previous value
jan 1, 1966
668.381 mln
+668.381 mln
0.0%
jan 1, 1967
699.048 mln
+30.667 mln
4.59%
jan 1, 1968
739.619 mln
+40.571 mln
5.8%
jan 1, 1969
813.714 mln
+74.095 mln
10.02%
jan 1, 1970
878.286 mln
+64.571 mln
7.94%
jan 1, 1971
1.174 bln
+296.19 mln
33.72%
jan 1, 1972
1.328 bln
+153.694 mln
13.09%
jan 1, 1973
1.716 bln
+387.403 mln
29.17%
jan 1, 1974
2.159 bln
+443.82 mln
25.87%
jan 1, 1975
2.519 bln
+359.508 mln
16.65%
jan 1, 1976
3.197 bln
+677.968 mln
26.92%
jan 1, 1977
3.348 bln
+151.313 mln
4.73%
jan 1, 1978
3.979 bln
+631.306 mln
18.86%
jan 1, 1979
4.596 bln
+616.861 mln
15.5%
jan 1, 1980
5.288 bln
+691.229 mln
15.04%
jan 1, 1981
6.646 bln
+1.358 bln
25.69%
jan 1, 1982
6.417 bln
-228.463 mln
-3.44%
jan 1, 1983
6.409 bln
-8.031 mln
-0.13%
jan 1, 1984
6.251 bln
-158.461 mln
-2.47%
jan 1, 1985
6.23 bln
-21.224 mln
-0.34%
jan 1, 1986
6.381 bln
+150.927 mln
2.42%
jan 1, 1987
7.261 bln
+880.748 mln
13.8%
jan 1, 1988
7.515 bln
+253.809 mln
3.5%
jan 1, 1989
7.969 bln
+453.846 mln
6.04%
jan 1, 1990
8.021 bln
+52.499 mln
0.66%
jan 1, 1991
9.83 bln
+1.808 bln
22.54%
jan 1, 1992
10.325 bln
+494.788 mln
5.03%
jan 1, 1993
12.047 bln
+1.722 bln
16.68%
jan 1, 1994
11.436 bln
-610.938 mln
-5.07%
jan 1, 1995
12.24 bln
+803.535 mln
7.03%
jan 1, 1996
14.281 bln
+2.042 bln
16.68%
jan 1, 1997
14.982 bln
+700.54 mln
4.91%
jan 1, 1998
16.144 bln
+1.162 bln
7.75%
jan 1, 1999
17.012 bln
+868.089 mln
5.38%
jan 1, 2000
17.742 bln
+730.02 mln
4.29%
jan 1, 2001
16.594 bln
-1.147 bln
-6.47%
jan 1, 2002
17.154 bln
+559.587 mln
3.37%
jan 1, 2003
18.505 bln
+1.351 bln
7.88%
jan 1, 2004
21.99 bln
+3.485 bln
18.83%
jan 1, 2005
24.706 bln
+2.716 bln
12.35%
jan 1, 2006
25.401 bln
+695.527 mln
2.82%
jan 1, 2007
26.965 bln
+1.564 bln
6.16%
jan 1, 2008
30.374 bln
+3.41 bln
12.64%
jan 1, 2009
34.587 bln
+4.213 bln
13.87%
jan 1, 2010
33.767 bln
-819.774 mln
-2.37%
jan 1, 2011
34.399 bln
+631.238 mln
1.87%
jan 1, 2012
38.423 bln
+4.025 bln
11.7%
jan 1, 2013
38.071 bln
-352.43 mln
-0.92%
jan 1, 2014
39.926 bln
+1.855 bln
4.87%
jan 1, 2015
41.504 bln
+1.579 bln
3.95%
jan 1, 2016
38.432 bln
-3.072 bln
-7.4%
Ranking of countries by current statistics by years


Comments: