29
/
en
AIzaSyAYiBZKx7MnpbEhh9jyipgxe19OcubqV5w
April 1, 2024
112209
Costa Rica
CRI
true
2
1
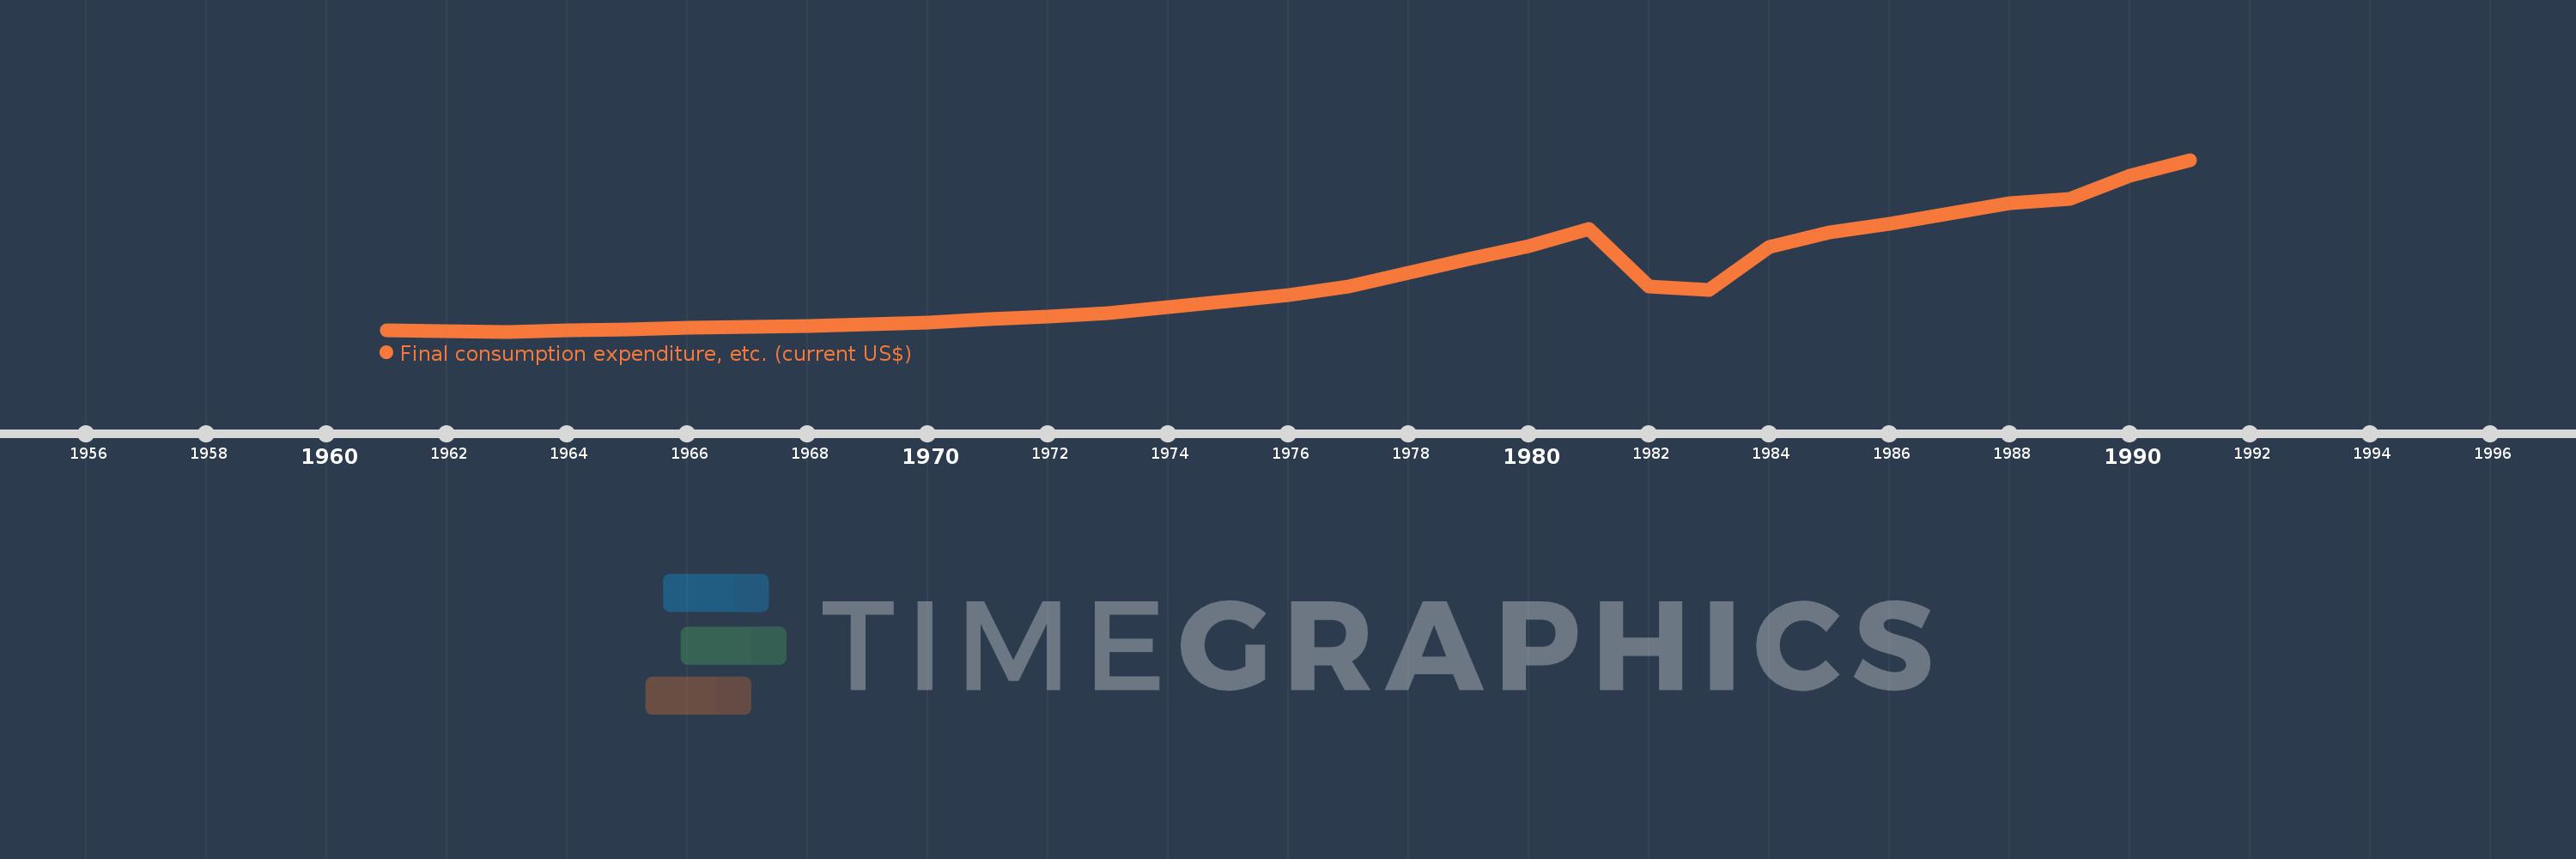
Final consumption expenditure, etc. (current US$)
1991,1990,1989,1988,1987,1986,1985,1984,1983,1982,1981,1980,1979,1978,1977,1976,1975,1974,1973,1972,1971,1970,1969,1968,1967,1966,1965,1964,1963,1962,1961
This statistics in other country:
AfghanistanAlbaniaAlgeriaAngolaAntigua and BarbudaArab WorldArgentinaArmeniaArubaAustraliaAustriaAzerbaijanBahamas, TheBahrainBangladeshBarbadosBelarusBelgiumBelizeBeninBermudaBhutanBoliviaBosnia and HerzegovinaBotswanaBrazilBrunei DarussalamBulgariaBurkina FasoBurundiCabo VerdeCambodiaCameroonCanadaCaribbean small statesCentral African RepublicCentral Europe and the BalticsChadChileChinaColombiaComorosCongo, Dem. Rep.Congo, Rep.Costa RicaCote d'IvoireCroatiaCubaCyprusCzech RepublicDenmarkDjiboutiDominicaDominican RepublicEarly-demographic dividendEast Asia & PacificEast Asia & Pacific (excluding high income)East Asia & Pacific (IDA & IBRD countries)EcuadorEgypt, Arab Rep.El SalvadorEquatorial GuineaEritreaEstoniaEthiopiaEuro areaEurope & Central AsiaEurope & Central Asia (excluding high income)Europe & Central Asia (IDA & IBRD countries)European UnionFaroe IslandsFijiFinlandFragile and conflict affected situationsFranceGabonGambia, TheGeorgiaGermanyGhanaGreeceGrenadaGuatemalaGuineaGuinea-BissauGuyanaHaitiHeavily indebted poor countries (HIPC)High incomeHondurasHong Kong SAR, ChinaHungaryIBRD onlyIcelandIDA & IBRD totalIDA blendIDA onlyIDA totalIndiaIndonesiaIran, Islamic Rep.IraqIrelandIsraelItalyJamaicaJapanJordanKazakhstanKenyaKiribatiKorea, Rep.KosovoKuwaitKyrgyz RepublicLao PDRLate-demographic dividendLatin America & Caribbean Latin America & Caribbean (excluding high income)Latin America & the Caribbean (IDA & IBRD countries)LatviaLeast developed countries: UN classificationLebanonLesothoLiberiaLibyaLithuaniaLow & middle incomeLow incomeLower middle incomeLuxembourgMacao SAR, ChinaMacedonia, FYRMadagascarMalawiMalaysiaMaldivesMaliMaltaMauritaniaMauritiusMexicoMicronesia, Fed. Sts.Middle East & North AfricaMiddle East & North Africa (excluding high income)Middle East & North Africa (IDA & IBRD countries)Middle incomeMoldovaMongoliaMontenegroMoroccoMozambiqueNamibiaNepalNetherlandsNew CaledoniaNew ZealandNicaraguaNigerNigeriaNorth AmericaNorwayOECD membersOmanOther small statesPakistanPanamaPapua New GuineaParaguayPeruPhilippinesPolandPortugalPost-demographic dividendPre-demographic dividendPuerto RicoQatarRomaniaRussian FederationRwandaSaudi ArabiaSenegalSerbiaSeychellesSierra LeoneSingaporeSlovak RepublicSloveniaSmall statesSolomon IslandsSouth AfricaSouth AsiaSouth Asia (IDA & IBRD)South SudanSpainSri LankaSt. Kitts and NevisSt. LuciaSt. Vincent and the GrenadinesSub-Saharan Africa Sub-Saharan Africa (excluding high income)Sub-Saharan Africa (IDA & IBRD countries)SudanSurinameSwazilandSwedenSwitzerlandSyrian Arab RepublicTajikistanTanzaniaThailandTimor-LesteTogoTongaTrinidad and TobagoTunisiaTurkeyTurkmenistanUgandaUkraineUnited Arab EmiratesUnited KingdomUnited StatesUpper middle incomeUruguayUzbekistanVanuatuVenezuela, RBVietnamWest Bank and GazaWorldYemen, Rep.ZambiaZimbabwe Timeline:
This timeline shows a graph from 1961 to 1991 of Costa Rica. No data until 1960. Number of actual observations by date: 31.
Source name:
World Development Indicators
Source organization:
World Bank national accounts data, and OECD National Accounts data files.
Categories, topics:
Economy & Growth
Last updated:
apr 23, 2017
Indicators value changes by year
Minimum:
399.167 mln
jan 1, 1963
Maximum:
6.484 bln
jan 1, 1991
At the date of observation
Value
Absolute change
Change from previous value
jan 1, 1961
442.862 mln
+442.862 mln
0.0%
jan 1, 1962
415.504 mln
-27.358 mln
-6.18%
jan 1, 1963
399.167 mln
-16.336 mln
-3.93%
jan 1, 1964
439.016 mln
+39.849 mln
9.98%
jan 1, 1965
474.745 mln
+35.729 mln
8.14%
jan 1, 1966
536.709 mln
+61.964 mln
13.05%
jan 1, 1967
560.906 mln
+24.196 mln
4.51%
jan 1, 1968
607.306 mln
+46.4 mln
8.27%
jan 1, 1969
669.253 mln
+61.947 mln
10.2%
jan 1, 1970
726.974 mln
+57.721 mln
8.62%
jan 1, 1971
849.253 mln
+122.279 mln
16.82%
jan 1, 1972
926.907 mln
+77.654 mln
9.14%
jan 1, 1973
1.045 bln
+118.293 mln
12.76%
jan 1, 1974
1.255 bln
+210.156 mln
20.11%
jan 1, 1975
1.468 bln
+212.399 mln
16.92%
jan 1, 1976
1.703 bln
+235.15 mln
16.02%
jan 1, 1977
1.986 bln
+283.582 mln
16.65%
jan 1, 1978
2.495 bln
+508.203 mln
25.58%
jan 1, 1979
2.973 bln
+478.506 mln
19.18%
jan 1, 1980
3.428 bln
+455.239 mln
15.31%
jan 1, 1981
4.047 bln
+618.693 mln
18.05%
jan 1, 1982
1.991 bln
-2.056 bln
-50.81%
jan 1, 1983
1.887 bln
-103.915 mln
-5.22%
jan 1, 1984
3.382 bln
+1.495 bln
79.22%
jan 1, 1985
3.92 bln
+537.732 mln
15.9%
jan 1, 1986
4.214 bln
+293.996 mln
7.5%
jan 1, 1987
4.594 bln
+379.853 mln
9.01%
jan 1, 1988
4.937 bln
+343.223 mln
7.47%
jan 1, 1989
5.112 bln
+175.064 mln
3.55%
jan 1, 1990
5.91 bln
+798.543 mln
15.62%
jan 1, 1991
6.484 bln
+573.846 mln
9.71%
Ranking of countries by current statistics by years


Comments: