29
/
en
AIzaSyAYiBZKx7MnpbEhh9jyipgxe19OcubqV5w
April 1, 2024
228443
Romania
ROU
true
2
1
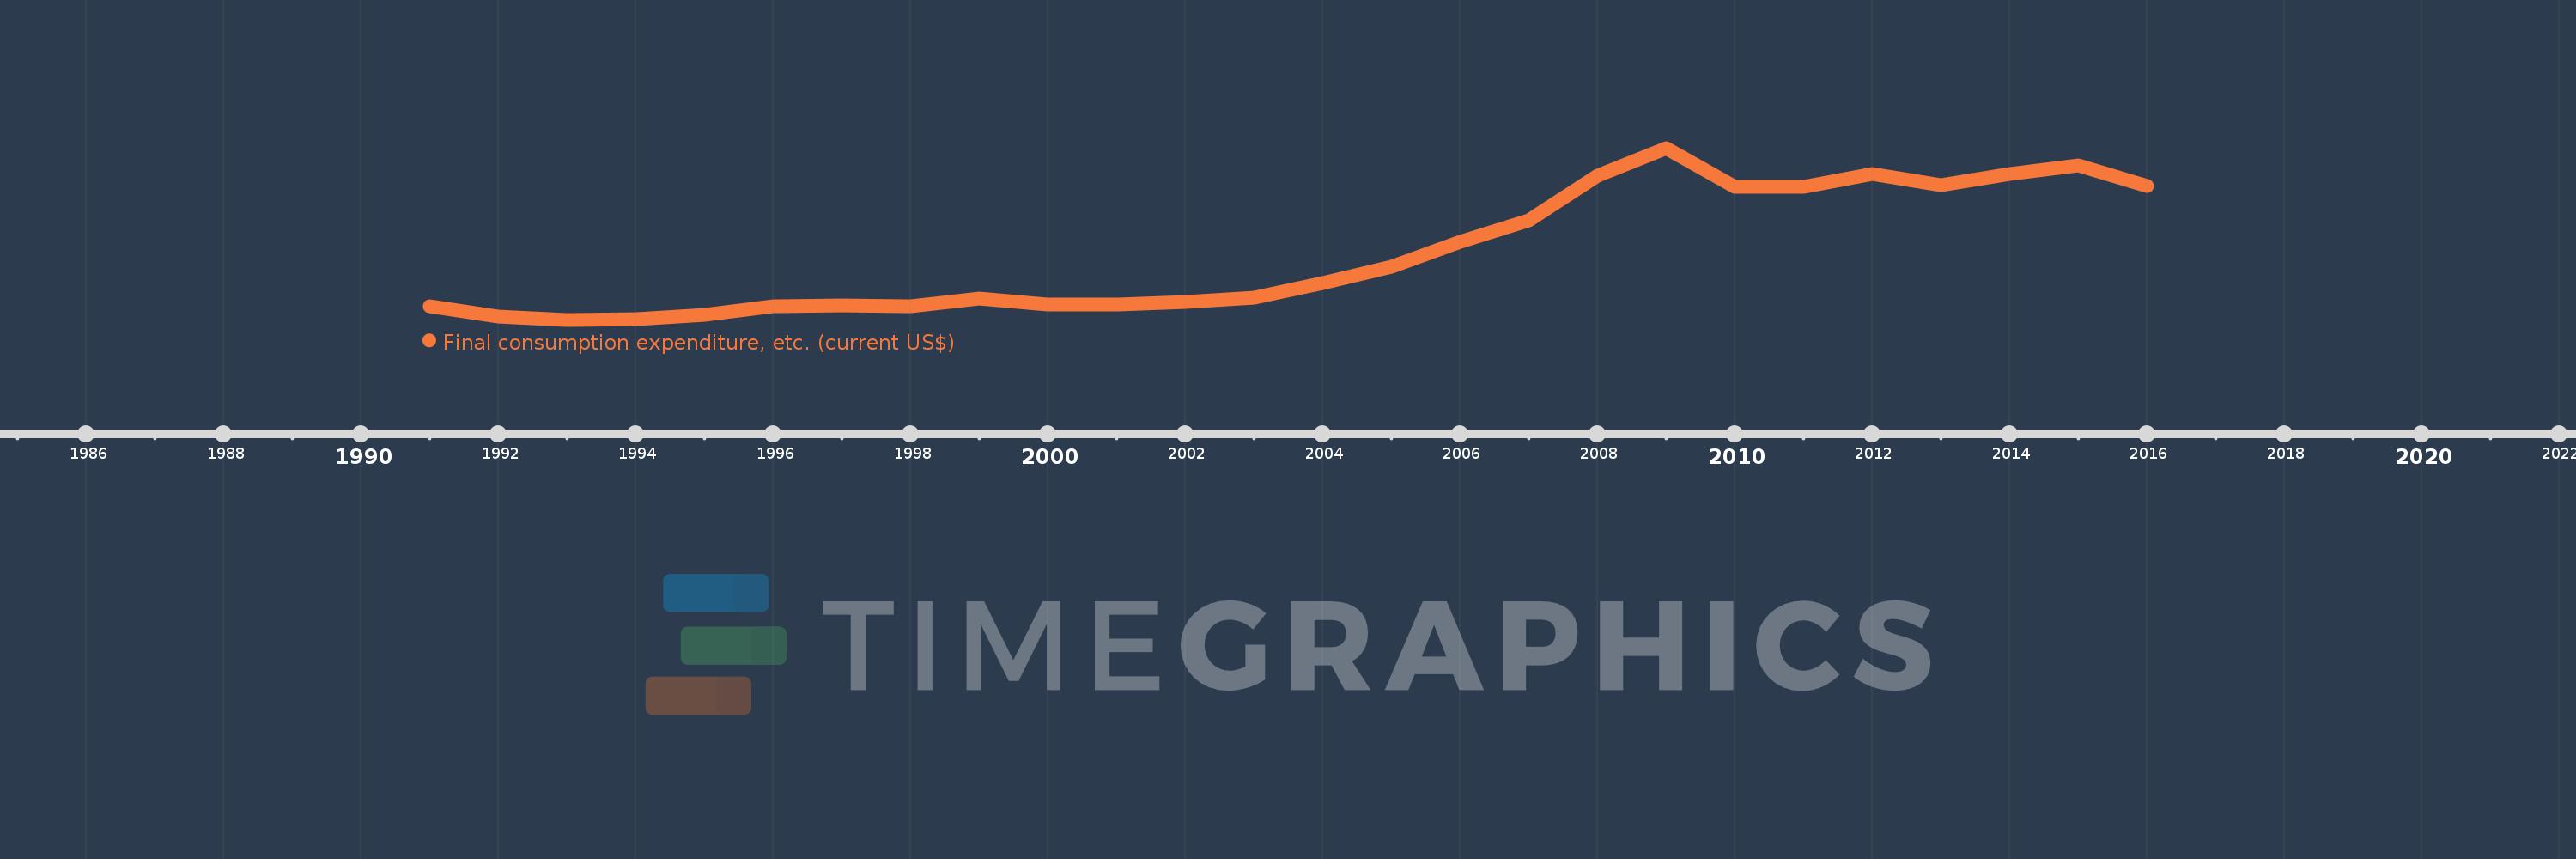
Final consumption expenditure, etc. (current US$)
2016,2015,2014,2013,2012,2011,2010,2009,2008,2007,2006,2005,2004,2003,2002,2001,2000,1999,1998,1997,1996,1995,1994,1993,1992,1991
This statistics in other country:
AfghanistanAlbaniaAlgeriaAngolaAntigua and BarbudaArab WorldArgentinaArmeniaArubaAustraliaAustriaAzerbaijanBahamas, TheBahrainBangladeshBarbadosBelarusBelgiumBelizeBeninBermudaBhutanBoliviaBosnia and HerzegovinaBotswanaBrazilBrunei DarussalamBulgariaBurkina FasoBurundiCabo VerdeCambodiaCameroonCanadaCaribbean small statesCentral African RepublicCentral Europe and the BalticsChadChileChinaColombiaComorosCongo, Dem. Rep.Congo, Rep.Costa RicaCote d'IvoireCroatiaCubaCyprusCzech RepublicDenmarkDjiboutiDominicaDominican RepublicEarly-demographic dividendEast Asia & PacificEast Asia & Pacific (excluding high income)East Asia & Pacific (IDA & IBRD countries)EcuadorEgypt, Arab Rep.El SalvadorEquatorial GuineaEritreaEstoniaEthiopiaEuro areaEurope & Central AsiaEurope & Central Asia (excluding high income)Europe & Central Asia (IDA & IBRD countries)European UnionFaroe IslandsFijiFinlandFragile and conflict affected situationsFranceGabonGambia, TheGeorgiaGermanyGhanaGreeceGrenadaGuatemalaGuineaGuinea-BissauGuyanaHaitiHeavily indebted poor countries (HIPC)High incomeHondurasHong Kong SAR, ChinaHungaryIBRD onlyIcelandIDA & IBRD totalIDA blendIDA onlyIDA totalIndiaIndonesiaIran, Islamic Rep.IraqIrelandIsraelItalyJamaicaJapanJordanKazakhstanKenyaKiribatiKorea, Rep.KosovoKuwaitKyrgyz RepublicLao PDRLate-demographic dividendLatin America & Caribbean Latin America & Caribbean (excluding high income)Latin America & the Caribbean (IDA & IBRD countries)LatviaLeast developed countries: UN classificationLebanonLesothoLiberiaLibyaLithuaniaLow & middle incomeLow incomeLower middle incomeLuxembourgMacao SAR, ChinaMacedonia, FYRMadagascarMalawiMalaysiaMaldivesMaliMaltaMauritaniaMauritiusMexicoMicronesia, Fed. Sts.Middle East & North AfricaMiddle East & North Africa (excluding high income)Middle East & North Africa (IDA & IBRD countries)Middle incomeMoldovaMongoliaMontenegroMoroccoMozambiqueNamibiaNepalNetherlandsNew CaledoniaNew ZealandNicaraguaNigerNigeriaNorth AmericaNorwayOECD membersOmanOther small statesPakistanPanamaPapua New GuineaParaguayPeruPhilippinesPolandPortugalPost-demographic dividendPre-demographic dividendPuerto RicoQatarRomaniaRussian FederationRwandaSaudi ArabiaSenegalSerbiaSeychellesSierra LeoneSingaporeSlovak RepublicSloveniaSmall statesSolomon IslandsSouth AfricaSouth AsiaSouth Asia (IDA & IBRD)South SudanSpainSri LankaSt. Kitts and NevisSt. LuciaSt. Vincent and the GrenadinesSub-Saharan Africa Sub-Saharan Africa (excluding high income)Sub-Saharan Africa (IDA & IBRD countries)SudanSurinameSwazilandSwedenSwitzerlandSyrian Arab RepublicTajikistanTanzaniaThailandTimor-LesteTogoTongaTrinidad and TobagoTunisiaTurkeyTurkmenistanUgandaUkraineUnited Arab EmiratesUnited KingdomUnited StatesUpper middle incomeUruguayUzbekistanVanuatuVenezuela, RBVietnamWest Bank and GazaWorldYemen, Rep.ZambiaZimbabwe Timeline:
This timeline shows a graph from 1991 to 2016 of Romania. No data until 1990. Number of actual observations by date: 26.
Source name:
World Development Indicators
Source organization:
World Bank national accounts data, and OECD National Accounts data files.
Categories, topics:
Economy & Growth
Last updated:
apr 23, 2017
Indicators value changes by year
Minimum:
19.344 bln
jan 1, 1993
Maximum:
166.158 bln
jan 1, 2009
At the date of observation
Value
Absolute change
Change from previous value
jan 1, 1991
30.886 bln
+30.886 bln
0.0%
jan 1, 1992
22.007 bln
-8.88 bln
-28.75%
jan 1, 1993
19.344 bln
-2.662 bln
-12.1%
jan 1, 1994
20.047 bln
+703.07 mln
3.63%
jan 1, 1995
23.234 bln
+3.187 bln
15.9%
jan 1, 1996
30.665 bln
+7.431 bln
31.98%
jan 1, 1997
31.4 bln
+734.908 mln
2.4%
jan 1, 1998
30.563 bln
-836.598 mln
-2.66%
jan 1, 1999
37.466 bln
+6.903 bln
22.59%
jan 1, 2000
32.075 bln
-5.391 bln
-14.39%
jan 1, 2001
31.995 bln
-79.869 mln
-0.25%
jan 1, 2002
34.593 bln
+2.598 bln
8.12%
jan 1, 2003
38.392 bln
+3.799 bln
10.98%
jan 1, 2004
50.711 bln
+12.319 bln
32.09%
jan 1, 2005
64.52 bln
+13.809 bln
27.23%
jan 1, 2006
85.98 bln
+21.46 bln
33.26%
jan 1, 2007
104.633 bln
+18.653 bln
21.69%
jan 1, 2008
142.407 bln
+37.775 bln
36.1%
jan 1, 2009
166.158 bln
+23.751 bln
16.68%
jan 1, 2010
132.753 bln
-33.405 bln
-20.1%
jan 1, 2011
133.23 bln
+477.637 mln
0.36%
jan 1, 2012
144.043 bln
+10.812 bln
8.12%
jan 1, 2013
134.121 bln
-9.922 bln
-6.89%
jan 1, 2014
144.07 bln
+9.949 bln
7.42%
jan 1, 2015
151.114 bln
+7.044 bln
4.89%
jan 1, 2016
133.364 bln
-17.751 bln
-11.75%
Ranking of countries by current statistics by years


Comments: