29
/
en
AIzaSyAYiBZKx7MnpbEhh9jyipgxe19OcubqV5w
April 1, 2024
91107
Brazil
BRA
true
2
1
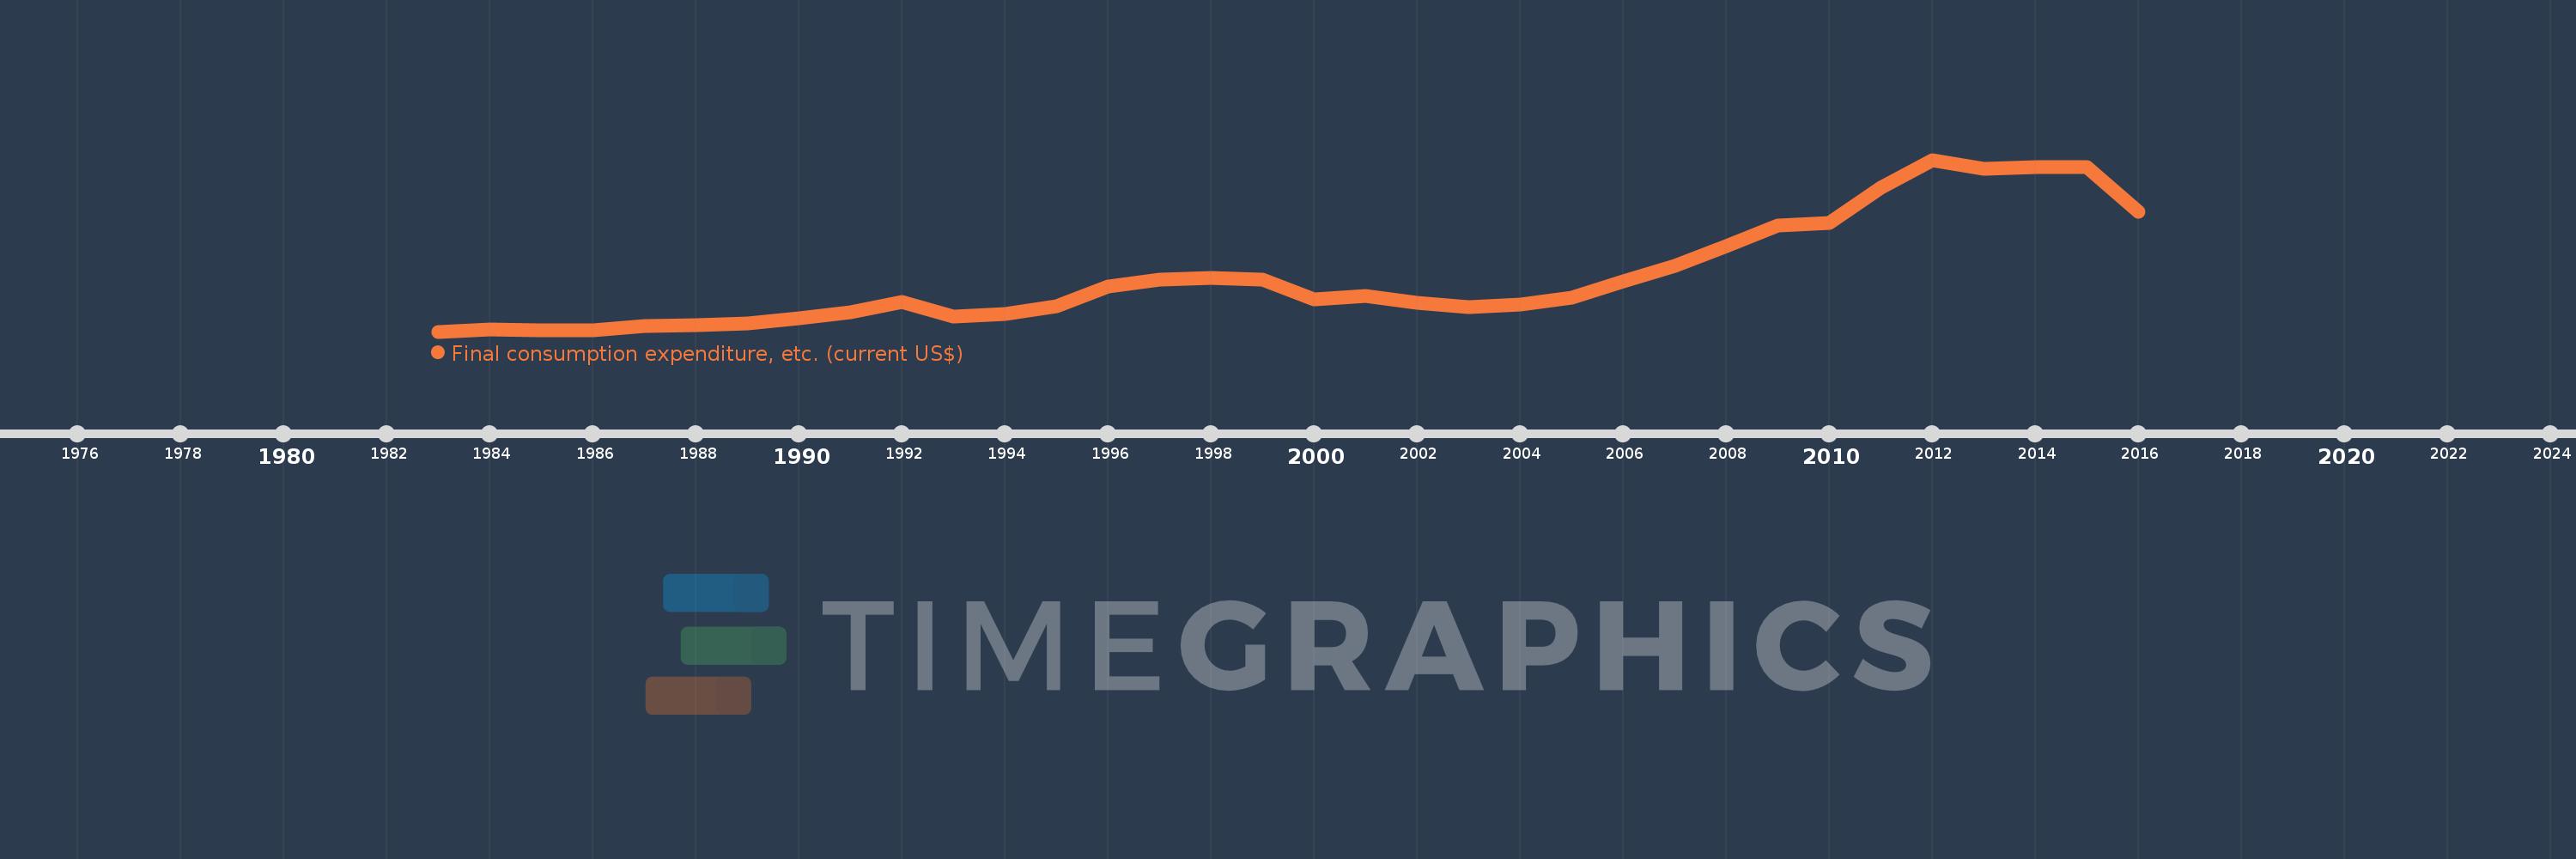
Final consumption expenditure, etc. (current US$)
2016,2015,2014,2013,2012,2011,2010,2009,2008,2007,2006,2005,2004,2003,2002,2001,2000,1999,1998,1997,1996,1995,1994,1993,1992,1991,1990,1989,1988,1987,1986,1985,1984,1983
This statistics in other country:
AfghanistanAlbaniaAlgeriaAngolaAntigua and BarbudaArab WorldArgentinaArmeniaArubaAustraliaAustriaAzerbaijanBahamas, TheBahrainBangladeshBarbadosBelarusBelgiumBelizeBeninBermudaBhutanBoliviaBosnia and HerzegovinaBotswanaBrazilBrunei DarussalamBulgariaBurkina FasoBurundiCabo VerdeCambodiaCameroonCanadaCaribbean small statesCentral African RepublicCentral Europe and the BalticsChadChileChinaColombiaComorosCongo, Dem. Rep.Congo, Rep.Costa RicaCote d'IvoireCroatiaCubaCyprusCzech RepublicDenmarkDjiboutiDominicaDominican RepublicEarly-demographic dividendEast Asia & PacificEast Asia & Pacific (excluding high income)East Asia & Pacific (IDA & IBRD countries)EcuadorEgypt, Arab Rep.El SalvadorEquatorial GuineaEritreaEstoniaEthiopiaEuro areaEurope & Central AsiaEurope & Central Asia (excluding high income)Europe & Central Asia (IDA & IBRD countries)European UnionFaroe IslandsFijiFinlandFragile and conflict affected situationsFranceGabonGambia, TheGeorgiaGermanyGhanaGreeceGrenadaGuatemalaGuineaGuinea-BissauGuyanaHaitiHeavily indebted poor countries (HIPC)High incomeHondurasHong Kong SAR, ChinaHungaryIBRD onlyIcelandIDA & IBRD totalIDA blendIDA onlyIDA totalIndiaIndonesiaIran, Islamic Rep.IraqIrelandIsraelItalyJamaicaJapanJordanKazakhstanKenyaKiribatiKorea, Rep.KosovoKuwaitKyrgyz RepublicLao PDRLate-demographic dividendLatin America & Caribbean Latin America & Caribbean (excluding high income)Latin America & the Caribbean (IDA & IBRD countries)LatviaLeast developed countries: UN classificationLebanonLesothoLiberiaLibyaLithuaniaLow & middle incomeLow incomeLower middle incomeLuxembourgMacao SAR, ChinaMacedonia, FYRMadagascarMalawiMalaysiaMaldivesMaliMaltaMauritaniaMauritiusMexicoMicronesia, Fed. Sts.Middle East & North AfricaMiddle East & North Africa (excluding high income)Middle East & North Africa (IDA & IBRD countries)Middle incomeMoldovaMongoliaMontenegroMoroccoMozambiqueNamibiaNepalNetherlandsNew CaledoniaNew ZealandNicaraguaNigerNigeriaNorth AmericaNorwayOECD membersOmanOther small statesPakistanPanamaPapua New GuineaParaguayPeruPhilippinesPolandPortugalPost-demographic dividendPre-demographic dividendPuerto RicoQatarRomaniaRussian FederationRwandaSaudi ArabiaSenegalSerbiaSeychellesSierra LeoneSingaporeSlovak RepublicSloveniaSmall statesSolomon IslandsSouth AfricaSouth AsiaSouth Asia (IDA & IBRD)South SudanSpainSri LankaSt. Kitts and NevisSt. LuciaSt. Vincent and the GrenadinesSub-Saharan Africa Sub-Saharan Africa (excluding high income)Sub-Saharan Africa (IDA & IBRD countries)SudanSurinameSwazilandSwedenSwitzerlandSyrian Arab RepublicTajikistanTanzaniaThailandTimor-LesteTogoTongaTrinidad and TobagoTunisiaTurkeyTurkmenistanUgandaUkraineUnited Arab EmiratesUnited KingdomUnited StatesUpper middle incomeUruguayUzbekistanVanuatuVenezuela, RBVietnamWest Bank and GazaWorldYemen, Rep.ZambiaZimbabwe Timeline:
This timeline shows a graph from 1983 to 2016 of Brazil. No data until 1982. Number of actual observations by date: 34.
Source name:
World Development Indicators
Source organization:
World Bank national accounts data, and OECD National Accounts data files.
Categories, topics:
Economy & Growth
Last updated:
apr 23, 2017
Indicators value changes by year
Minimum:
146.24 bln
jan 1, 1983
Maximum:
2.064 trl
jan 1, 2012
At the date of observation
Value
Absolute change
Change from previous value
jan 1, 1983
146.24 bln
+146.24 bln
0.0%
jan 1, 1984
172.485 bln
+26.245 bln
17.95%
jan 1, 1985
157.718 bln
-14.767 bln
-8.56%
jan 1, 1986
165.349 bln
+7.631 bln
4.84%
jan 1, 1987
208.91 bln
+43.561 bln
26.34%
jan 1, 1988
218.345 bln
+9.436 bln
4.52%
jan 1, 1989
238.1 bln
+19.755 bln
9.05%
jan 1, 1990
296.337 bln
+58.237 bln
24.46%
jan 1, 1991
363.072 bln
+66.735 bln
22.52%
jan 1, 1992
479.08 bln
+116.008 bln
31.95%
jan 1, 1993
314.8 bln
-164.28 bln
-34.29%
jan 1, 1994
340.373 bln
+25.573 bln
8.12%
jan 1, 1995
429.798 bln
+89.426 bln
26.27%
jan 1, 1996
649.806 bln
+220.008 bln
51.19%
jan 1, 1997
722.081 bln
+72.275 bln
11.12%
jan 1, 1998
749.349 bln
+27.267 bln
3.78%
jan 1, 1999
727.366 bln
-21.983 bln
-2.93%
jan 1, 2000
506.261 bln
-221.105 bln
-30.4%
jan 1, 2001
546.362 bln
+40.101 bln
7.92%
jan 1, 2002
466.803 bln
-79.559 bln
-14.56%
jan 1, 2003
415.047 bln
-51.756 bln
-11.09%
jan 1, 2004
451.804 bln
+36.758 bln
8.86%
jan 1, 2005
526.579 bln
+74.775 bln
16.55%
jan 1, 2006
707.904 bln
+181.325 bln
34.43%
jan 1, 2007
880.314 bln
+172.41 bln
24.36%
jan 1, 2008
1.101 trl
+220.839 bln
25.09%
jan 1, 2009
1.332 trl
+231.26 bln
21.0%
jan 1, 2010
1.36 trl
+27.995 bln
2.1%
jan 1, 2011
1.75 trl
+389.896 bln
28.66%
jan 1, 2012
2.064 trl
+314.062 bln
17.94%
jan 1, 2013
1.967 trl
-97.087 bln
-4.7%
jan 1, 2014
1.987 trl
+19.564 bln
0.99%
jan 1, 2015
1.979 trl
-8.025 bln
-0.4%
jan 1, 2016
1.483 trl
-495.679 bln
-25.05%
Ranking of countries by current statistics by years


Comments: