29
/
en
AIzaSyAYiBZKx7MnpbEhh9jyipgxe19OcubqV5w
April 1, 2024
58890
Sub-Saharan Africa
SSF
false
2
1
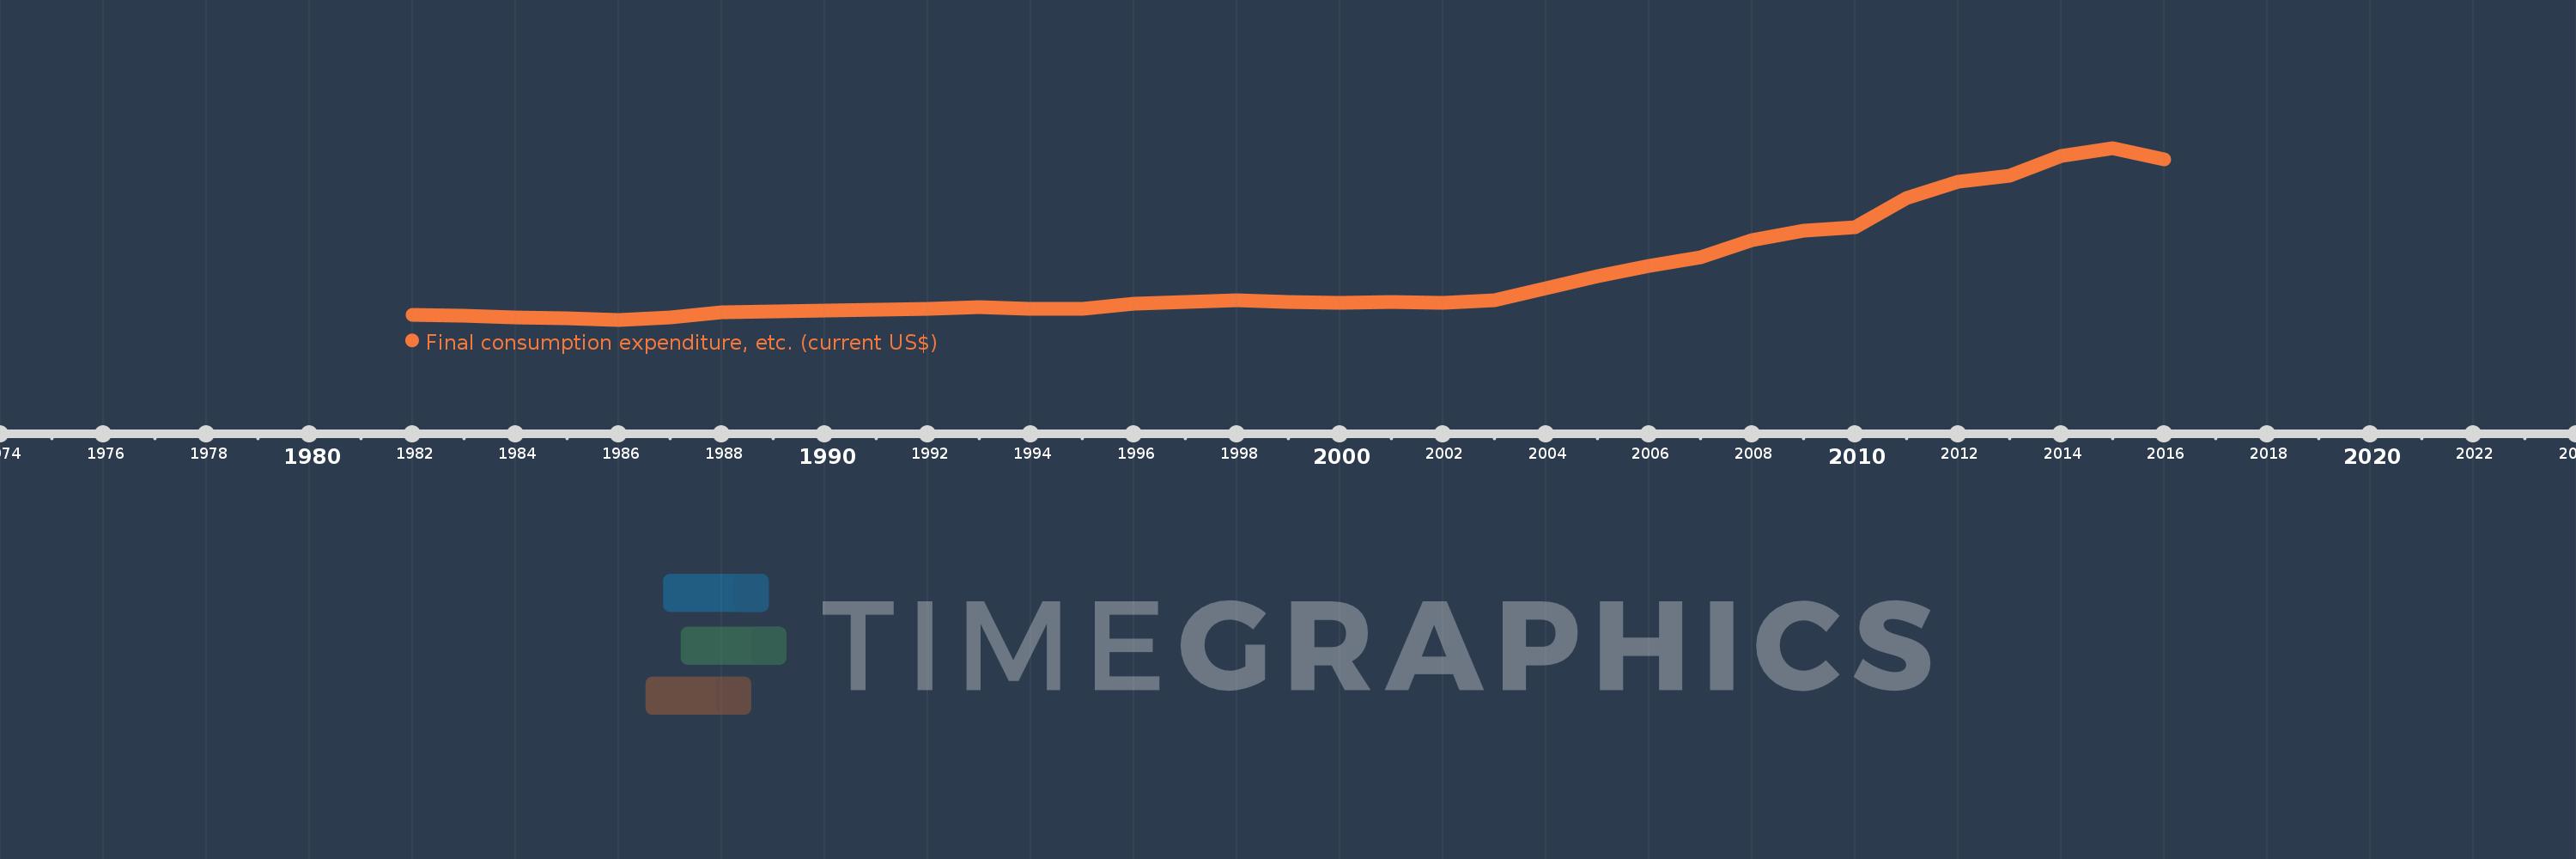
Final consumption expenditure, etc. (current US$)
2016,2015,2014,2013,2012,2011,2010,2009,2008,2007,2006,2005,2004,2003,2002,2001,2000,1999,1998,1997,1996,1995,1994,1993,1992,1991,1990,1989,1988,1987,1986,1985,1984,1983,1982
This statistics in other country:
AfghanistanAlbaniaAlgeriaAngolaAntigua and BarbudaArab WorldArgentinaArmeniaArubaAustraliaAustriaAzerbaijanBahamas, TheBahrainBangladeshBarbadosBelarusBelgiumBelizeBeninBermudaBhutanBoliviaBosnia and HerzegovinaBotswanaBrazilBrunei DarussalamBulgariaBurkina FasoBurundiCabo VerdeCambodiaCameroonCanadaCaribbean small statesCentral African RepublicCentral Europe and the BalticsChadChileChinaColombiaComorosCongo, Dem. Rep.Congo, Rep.Costa RicaCote d'IvoireCroatiaCubaCyprusCzech RepublicDenmarkDjiboutiDominicaDominican RepublicEarly-demographic dividendEast Asia & PacificEast Asia & Pacific (excluding high income)East Asia & Pacific (IDA & IBRD countries)EcuadorEgypt, Arab Rep.El SalvadorEquatorial GuineaEritreaEstoniaEthiopiaEuro areaEurope & Central AsiaEurope & Central Asia (excluding high income)Europe & Central Asia (IDA & IBRD countries)European UnionFaroe IslandsFijiFinlandFragile and conflict affected situationsFranceGabonGambia, TheGeorgiaGermanyGhanaGreeceGrenadaGuatemalaGuineaGuinea-BissauGuyanaHaitiHeavily indebted poor countries (HIPC)High incomeHondurasHong Kong SAR, ChinaHungaryIBRD onlyIcelandIDA & IBRD totalIDA blendIDA onlyIDA totalIndiaIndonesiaIran, Islamic Rep.IraqIrelandIsraelItalyJamaicaJapanJordanKazakhstanKenyaKiribatiKorea, Rep.KosovoKuwaitKyrgyz RepublicLao PDRLate-demographic dividendLatin America & Caribbean Latin America & Caribbean (excluding high income)Latin America & the Caribbean (IDA & IBRD countries)LatviaLeast developed countries: UN classificationLebanonLesothoLiberiaLibyaLithuaniaLow & middle incomeLow incomeLower middle incomeLuxembourgMacao SAR, ChinaMacedonia, FYRMadagascarMalawiMalaysiaMaldivesMaliMaltaMauritaniaMauritiusMexicoMicronesia, Fed. Sts.Middle East & North AfricaMiddle East & North Africa (excluding high income)Middle East & North Africa (IDA & IBRD countries)Middle incomeMoldovaMongoliaMontenegroMoroccoMozambiqueNamibiaNepalNetherlandsNew CaledoniaNew ZealandNicaraguaNigerNigeriaNorth AmericaNorwayOECD membersOmanOther small statesPakistanPanamaPapua New GuineaParaguayPeruPhilippinesPolandPortugalPost-demographic dividendPre-demographic dividendPuerto RicoQatarRomaniaRussian FederationRwandaSaudi ArabiaSenegalSerbiaSeychellesSierra LeoneSingaporeSlovak RepublicSloveniaSmall statesSolomon IslandsSouth AfricaSouth AsiaSouth Asia (IDA & IBRD)South SudanSpainSri LankaSt. Kitts and NevisSt. LuciaSt. Vincent and the GrenadinesSub-Saharan Africa Sub-Saharan Africa (excluding high income)Sub-Saharan Africa (IDA & IBRD countries)SudanSurinameSwazilandSwedenSwitzerlandSyrian Arab RepublicTajikistanTanzaniaThailandTimor-LesteTogoTongaTrinidad and TobagoTunisiaTurkeyTurkmenistanUgandaUkraineUnited Arab EmiratesUnited KingdomUnited StatesUpper middle incomeUruguayUzbekistanVanuatuVenezuela, RBVietnamWest Bank and GazaWorldYemen, Rep.ZambiaZimbabwe Timeline:
This timeline shows a graph from 1982 to 2016 of Sub-Saharan Africa . No data until 1981. Number of actual observations by date: 35.
Source name:
World Development Indicators
Source organization:
World Bank national accounts data, and OECD National Accounts data files.
Categories, topics:
Economy & Growth
Last updated:
apr 23, 2017
Indicators value changes by year
Minimum:
160.729 bln
jan 1, 1986
Maximum:
1.434 trl
jan 1, 2015
At the date of observation
Value
Absolute change
Change from previous value
jan 1, 1982
200.166 bln
+200.166 bln
0.0%
jan 1, 1983
192.339 bln
-7.828 bln
-3.91%
jan 1, 1984
177.651 bln
-14.688 bln
-7.64%
jan 1, 1985
174.237 bln
-3.414 bln
-1.92%
jan 1, 1986
160.729 bln
-13.508 bln
-7.75%
jan 1, 1987
181.042 bln
+20.313 bln
12.64%
jan 1, 1988
215.832 bln
+34.79 bln
19.22%
jan 1, 1989
224.776 bln
+8.944 bln
4.14%
jan 1, 1990
231.588 bln
+6.812 bln
3.03%
jan 1, 1991
235.88 bln
+4.292 bln
1.85%
jan 1, 1992
244.243 bln
+8.363 bln
3.55%
jan 1, 1993
255.012 bln
+10.769 bln
4.41%
jan 1, 1994
243.412 bln
-11.6 bln
-4.55%
jan 1, 1995
240.634 bln
-2.779 bln
-1.14%
jan 1, 1996
280.174 bln
+39.541 bln
16.43%
jan 1, 1997
289.351 bln
+9.177 bln
3.28%
jan 1, 1998
304.221 bln
+14.87 bln
5.14%
jan 1, 1999
293.947 bln
-10.275 bln
-3.38%
jan 1, 2000
287.736 bln
-6.21 bln
-2.11%
jan 1, 2001
292.704 bln
+4.967 bln
1.73%
jan 1, 2002
283.481 bln
-9.222 bln
-3.15%
jan 1, 2003
305.875 bln
+22.393 bln
7.9%
jan 1, 2004
392.684 bln
+86.81 bln
28.38%
jan 1, 2005
481.875 bln
+89.191 bln
22.71%
jan 1, 2006
559.317 bln
+77.441 bln
16.07%
jan 1, 2007
622.293 bln
+62.977 bln
11.26%
jan 1, 2008
750.231 bln
+127.937 bln
20.56%
jan 1, 2009
821.334 bln
+71.104 bln
9.48%
jan 1, 2010
843.985 bln
+22.651 bln
2.76%
jan 1, 2011
1.065 trl
+220.664 bln
26.15%
jan 1, 2012
1.182 trl
+117.172 bln
11.01%
jan 1, 2013
1.23 trl
+48.001 bln
4.06%
jan 1, 2014
1.375 trl
+144.713 bln
11.77%
jan 1, 2015
1.434 trl
+59.186 bln
4.31%
jan 1, 2016
1.35 trl
-83.894 bln
-5.85%
Ranking of countries by current statistics by years


Comments: