29
/
en
AIzaSyAYiBZKx7MnpbEhh9jyipgxe19OcubqV5w
April 1, 2024
24857
Caribbean small states
CSS
false
2
1
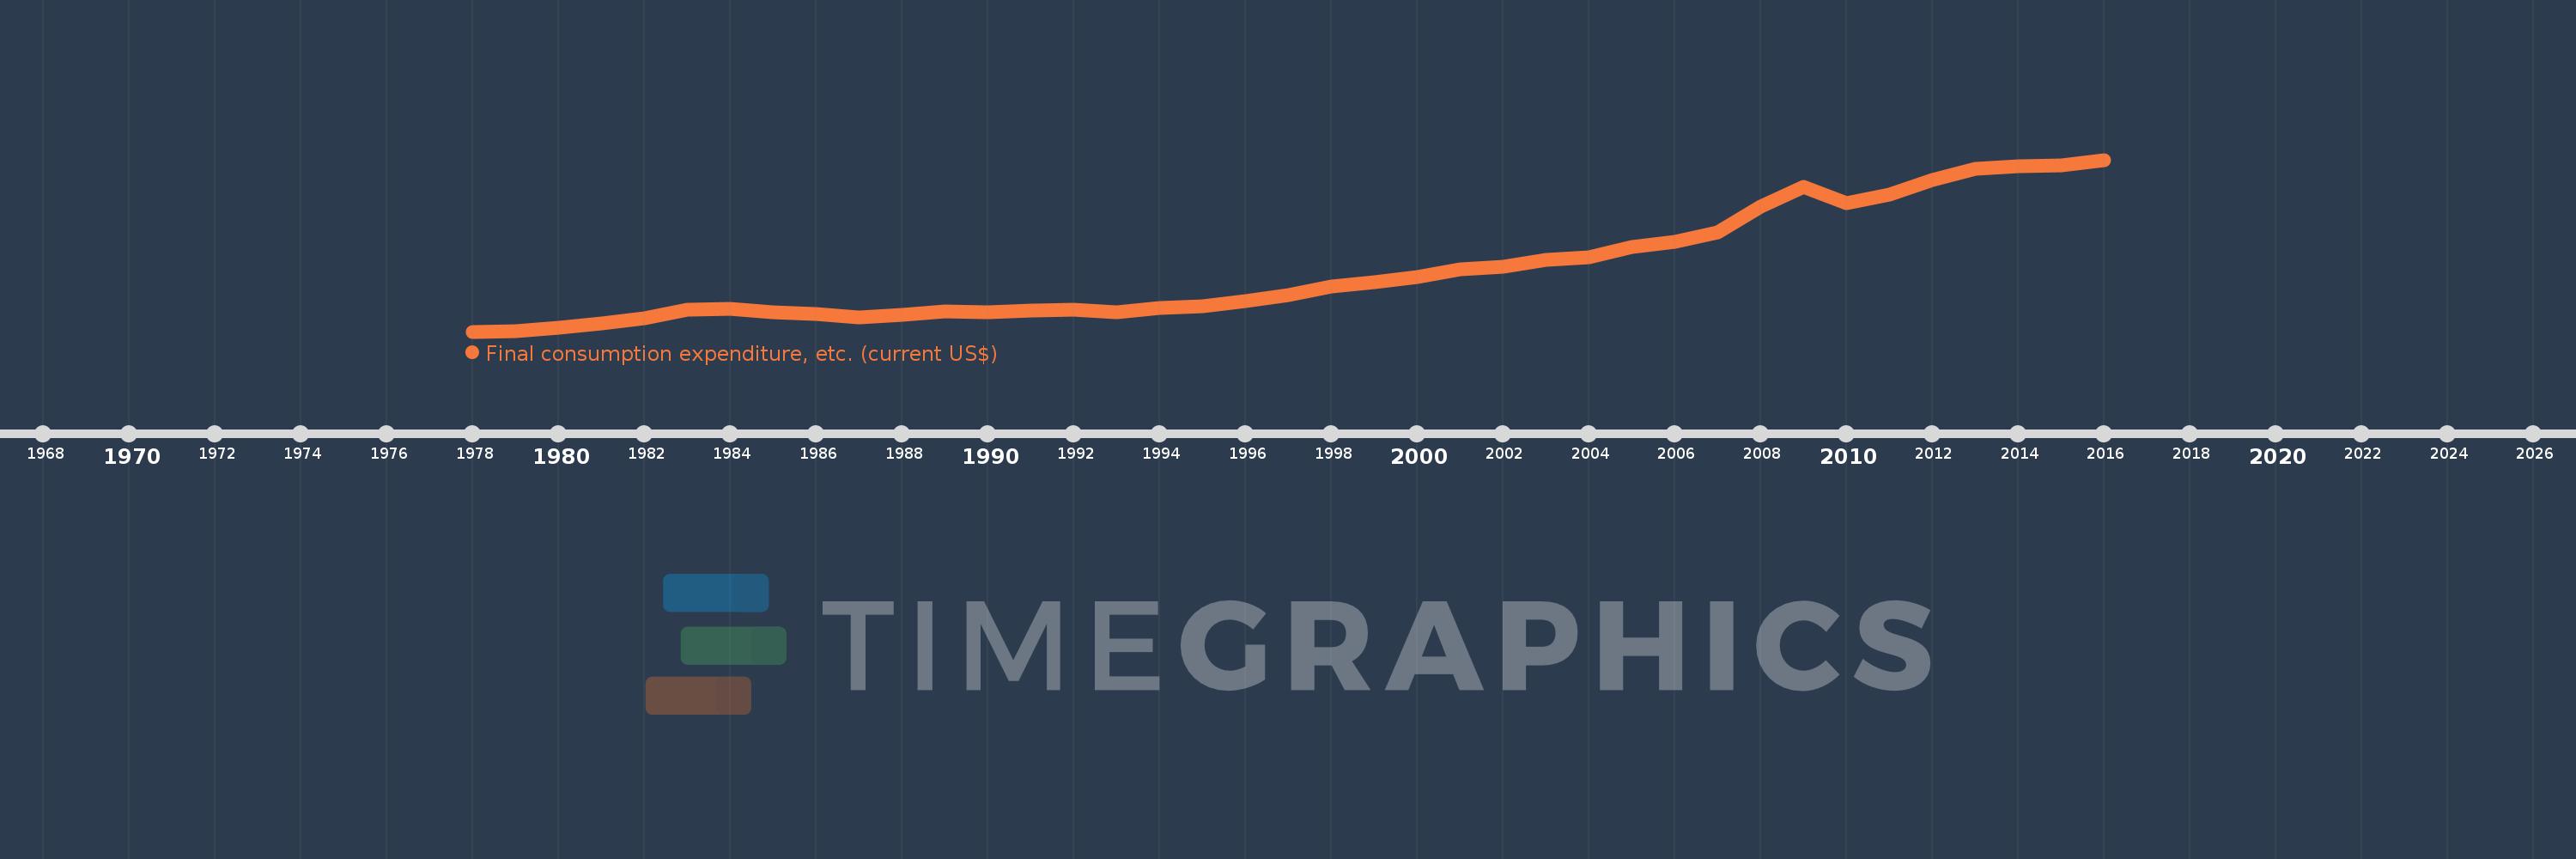
Final consumption expenditure, etc. (current US$)
2016,2015,2014,2013,2012,2011,2010,2009,2008,2007,2006,2005,2004,2003,2002,2001,2000,1999,1998,1997,1996,1995,1994,1993,1992,1991,1990,1989,1988,1987,1986,1985,1984,1983,1982,1981,1980,1979,1978
This statistics in other country:
AfghanistanAlbaniaAlgeriaAngolaAntigua and BarbudaArab WorldArgentinaArmeniaArubaAustraliaAustriaAzerbaijanBahamas, TheBahrainBangladeshBarbadosBelarusBelgiumBelizeBeninBermudaBhutanBoliviaBosnia and HerzegovinaBotswanaBrazilBrunei DarussalamBulgariaBurkina FasoBurundiCabo VerdeCambodiaCameroonCanadaCaribbean small statesCentral African RepublicCentral Europe and the BalticsChadChileChinaColombiaComorosCongo, Dem. Rep.Congo, Rep.Costa RicaCote d'IvoireCroatiaCubaCyprusCzech RepublicDenmarkDjiboutiDominicaDominican RepublicEarly-demographic dividendEast Asia & PacificEast Asia & Pacific (excluding high income)East Asia & Pacific (IDA & IBRD countries)EcuadorEgypt, Arab Rep.El SalvadorEquatorial GuineaEritreaEstoniaEthiopiaEuro areaEurope & Central AsiaEurope & Central Asia (excluding high income)Europe & Central Asia (IDA & IBRD countries)European UnionFaroe IslandsFijiFinlandFragile and conflict affected situationsFranceGabonGambia, TheGeorgiaGermanyGhanaGreeceGrenadaGuatemalaGuineaGuinea-BissauGuyanaHaitiHeavily indebted poor countries (HIPC)High incomeHondurasHong Kong SAR, ChinaHungaryIBRD onlyIcelandIDA & IBRD totalIDA blendIDA onlyIDA totalIndiaIndonesiaIran, Islamic Rep.IraqIrelandIsraelItalyJamaicaJapanJordanKazakhstanKenyaKiribatiKorea, Rep.KosovoKuwaitKyrgyz RepublicLao PDRLate-demographic dividendLatin America & Caribbean Latin America & Caribbean (excluding high income)Latin America & the Caribbean (IDA & IBRD countries)LatviaLeast developed countries: UN classificationLebanonLesothoLiberiaLibyaLithuaniaLow & middle incomeLow incomeLower middle incomeLuxembourgMacao SAR, ChinaMacedonia, FYRMadagascarMalawiMalaysiaMaldivesMaliMaltaMauritaniaMauritiusMexicoMicronesia, Fed. Sts.Middle East & North AfricaMiddle East & North Africa (excluding high income)Middle East & North Africa (IDA & IBRD countries)Middle incomeMoldovaMongoliaMontenegroMoroccoMozambiqueNamibiaNepalNetherlandsNew CaledoniaNew ZealandNicaraguaNigerNigeriaNorth AmericaNorwayOECD membersOmanOther small statesPakistanPanamaPapua New GuineaParaguayPeruPhilippinesPolandPortugalPost-demographic dividendPre-demographic dividendPuerto RicoQatarRomaniaRussian FederationRwandaSaudi ArabiaSenegalSerbiaSeychellesSierra LeoneSingaporeSlovak RepublicSloveniaSmall statesSolomon IslandsSouth AfricaSouth AsiaSouth Asia (IDA & IBRD)South SudanSpainSri LankaSt. Kitts and NevisSt. LuciaSt. Vincent and the GrenadinesSub-Saharan Africa Sub-Saharan Africa (excluding high income)Sub-Saharan Africa (IDA & IBRD countries)SudanSurinameSwazilandSwedenSwitzerlandSyrian Arab RepublicTajikistanTanzaniaThailandTimor-LesteTogoTongaTrinidad and TobagoTunisiaTurkeyTurkmenistanUgandaUkraineUnited Arab EmiratesUnited KingdomUnited StatesUpper middle incomeUruguayUzbekistanVanuatuVenezuela, RBVietnamWest Bank and GazaWorldYemen, Rep.ZambiaZimbabwe Timeline:
This timeline shows a graph from 1978 to 2016 of Caribbean small states. No data until 1977. Number of actual observations by date: 39.
Source name:
World Development Indicators
Source organization:
World Bank national accounts data, and OECD National Accounts data files.
Categories, topics:
Economy & Growth
Last updated:
apr 23, 2017
Indicators value changes by year
Minimum:
7.08 bln
jan 1, 1978
Maximum:
58.178 bln
jan 1, 2016
At the date of observation
Value
Absolute change
Change from previous value
jan 1, 1978
7.08 bln
+7.08 bln
0.0%
jan 1, 1979
7.085 bln
+5.564 mln
0.08%
jan 1, 1980
8.133 bln
+1.048 bln
14.79%
jan 1, 1981
9.438 bln
+1.305 bln
16.04%
jan 1, 1982
11.086 bln
+1.648 bln
17.46%
jan 1, 1983
13.544 bln
+2.458 bln
22.17%
jan 1, 1984
13.94 bln
+396.476 mln
2.93%
jan 1, 1985
12.853 bln
-1.087 bln
-7.8%
jan 1, 1986
12.193 bln
-659.739 mln
-5.13%
jan 1, 1987
11.35 bln
-842.951 mln
-6.91%
jan 1, 1988
12.012 bln
+661.522 mln
5.83%
jan 1, 1989
13.019 bln
+1.008 bln
8.39%
jan 1, 1990
12.911 bln
-108.524 mln
-0.83%
jan 1, 1991
13.339 bln
+428.35 mln
3.32%
jan 1, 1992
13.545 bln
+205.295 mln
1.54%
jan 1, 1993
12.871 bln
-673.158 mln
-4.97%
jan 1, 1994
14.106 bln
+1.235 bln
9.59%
jan 1, 1995
14.581 bln
+474.351 mln
3.36%
jan 1, 1996
16.221 bln
+1.64 bln
11.25%
jan 1, 1997
17.811 bln
+1.59 bln
9.8%
jan 1, 1998
20.548 bln
+2.737 bln
15.37%
jan 1, 1999
21.729 bln
+1.181 bln
5.75%
jan 1, 2000
23.264 bln
+1.534 bln
7.06%
jan 1, 2001
25.677 bln
+2.414 bln
10.37%
jan 1, 2002
26.365 bln
+687.964 mln
2.68%
jan 1, 2003
28.492 bln
+2.126 bln
8.06%
jan 1, 2004
29.23 bln
+738.845 mln
2.59%
jan 1, 2005
32.373 bln
+3.143 bln
10.75%
jan 1, 2006
33.683 bln
+1.31 bln
4.05%
jan 1, 2007
36.52 bln
+2.837 bln
8.42%
jan 1, 2008
44.314 bln
+7.794 bln
21.34%
jan 1, 2009
50.174 bln
+5.86 bln
13.22%
jan 1, 2010
45.325 bln
-4.849 bln
-9.66%
jan 1, 2011
47.762 bln
+2.437 bln
5.38%
jan 1, 2012
52.113 bln
+4.351 bln
9.11%
jan 1, 2013
55.566 bln
+3.453 bln
6.63%
jan 1, 2014
56.306 bln
+740.434 mln
1.33%
jan 1, 2015
56.555 bln
+249.309 mln
0.44%
jan 1, 2016
58.178 bln
+1.623 bln
2.87%
Ranking of countries by current statistics by years


Comments: