29
/
en
AIzaSyAYiBZKx7MnpbEhh9jyipgxe19OcubqV5w
April 1, 2024
205227
Namibia
NAM
true
2
1
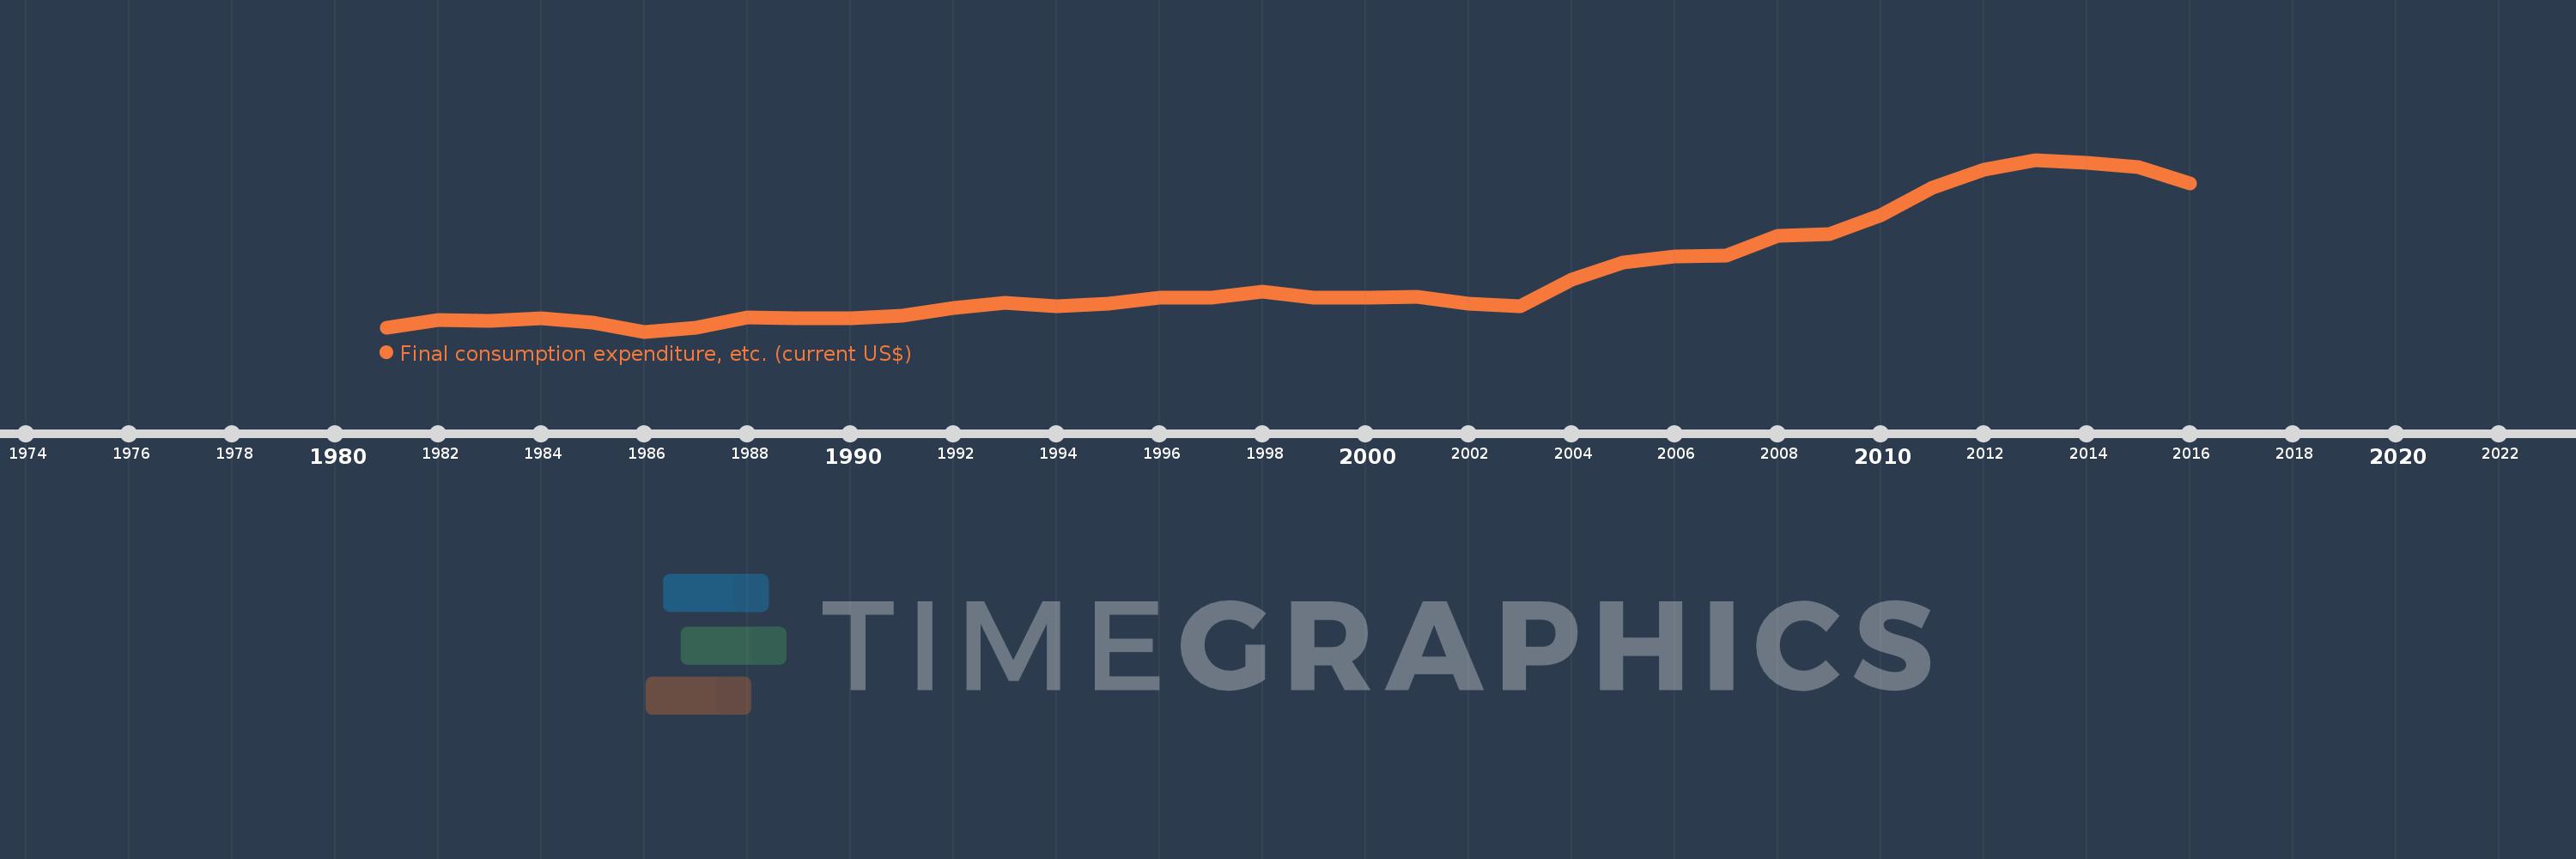
Final consumption expenditure, etc. (current US$)
2016,2015,2014,2013,2012,2011,2010,2009,2008,2007,2006,2005,2004,2003,2002,2001,2000,1999,1998,1997,1996,1995,1994,1993,1992,1991,1990,1989,1988,1987,1986,1985,1984,1983,1982,1981
This statistics in other country:
AfghanistanAlbaniaAlgeriaAngolaAntigua and BarbudaArab WorldArgentinaArmeniaArubaAustraliaAustriaAzerbaijanBahamas, TheBahrainBangladeshBarbadosBelarusBelgiumBelizeBeninBermudaBhutanBoliviaBosnia and HerzegovinaBotswanaBrazilBrunei DarussalamBulgariaBurkina FasoBurundiCabo VerdeCambodiaCameroonCanadaCaribbean small statesCentral African RepublicCentral Europe and the BalticsChadChileChinaColombiaComorosCongo, Dem. Rep.Congo, Rep.Costa RicaCote d'IvoireCroatiaCubaCyprusCzech RepublicDenmarkDjiboutiDominicaDominican RepublicEarly-demographic dividendEast Asia & PacificEast Asia & Pacific (excluding high income)East Asia & Pacific (IDA & IBRD countries)EcuadorEgypt, Arab Rep.El SalvadorEquatorial GuineaEritreaEstoniaEthiopiaEuro areaEurope & Central AsiaEurope & Central Asia (excluding high income)Europe & Central Asia (IDA & IBRD countries)European UnionFaroe IslandsFijiFinlandFragile and conflict affected situationsFranceGabonGambia, TheGeorgiaGermanyGhanaGreeceGrenadaGuatemalaGuineaGuinea-BissauGuyanaHaitiHeavily indebted poor countries (HIPC)High incomeHondurasHong Kong SAR, ChinaHungaryIBRD onlyIcelandIDA & IBRD totalIDA blendIDA onlyIDA totalIndiaIndonesiaIran, Islamic Rep.IraqIrelandIsraelItalyJamaicaJapanJordanKazakhstanKenyaKiribatiKorea, Rep.KosovoKuwaitKyrgyz RepublicLao PDRLate-demographic dividendLatin America & Caribbean Latin America & Caribbean (excluding high income)Latin America & the Caribbean (IDA & IBRD countries)LatviaLeast developed countries: UN classificationLebanonLesothoLiberiaLibyaLithuaniaLow & middle incomeLow incomeLower middle incomeLuxembourgMacao SAR, ChinaMacedonia, FYRMadagascarMalawiMalaysiaMaldivesMaliMaltaMauritaniaMauritiusMexicoMicronesia, Fed. Sts.Middle East & North AfricaMiddle East & North Africa (excluding high income)Middle East & North Africa (IDA & IBRD countries)Middle incomeMoldovaMongoliaMontenegroMoroccoMozambiqueNamibiaNepalNetherlandsNew CaledoniaNew ZealandNicaraguaNigerNigeriaNorth AmericaNorwayOECD membersOmanOther small statesPakistanPanamaPapua New GuineaParaguayPeruPhilippinesPolandPortugalPost-demographic dividendPre-demographic dividendPuerto RicoQatarRomaniaRussian FederationRwandaSaudi ArabiaSenegalSerbiaSeychellesSierra LeoneSingaporeSlovak RepublicSloveniaSmall statesSolomon IslandsSouth AfricaSouth AsiaSouth Asia (IDA & IBRD)South SudanSpainSri LankaSt. Kitts and NevisSt. LuciaSt. Vincent and the GrenadinesSub-Saharan Africa Sub-Saharan Africa (excluding high income)Sub-Saharan Africa (IDA & IBRD countries)SudanSurinameSwazilandSwedenSwitzerlandSyrian Arab RepublicTajikistanTanzaniaThailandTimor-LesteTogoTongaTrinidad and TobagoTunisiaTurkeyTurkmenistanUgandaUkraineUnited Arab EmiratesUnited KingdomUnited StatesUpper middle incomeUruguayUzbekistanVanuatuVenezuela, RBVietnamWest Bank and GazaWorldYemen, Rep.ZambiaZimbabwe Timeline:
This timeline shows a graph from 1981 to 2016 of Namibia. No data until 1980. Number of actual observations by date: 36.
Source name:
World Development Indicators
Source organization:
World Bank national accounts data, and OECD National Accounts data files.
Categories, topics:
Economy & Growth
Last updated:
apr 23, 2017
Indicators value changes by year
Minimum:
1.271 bln
jan 1, 1986
Maximum:
11.717 bln
jan 1, 2013
At the date of observation
Value
Absolute change
Change from previous value
jan 1, 1981
1.514 bln
+1.514 bln
0.0%
jan 1, 1982
1.997 bln
+483.394 mln
31.93%
jan 1, 1983
1.923 bln
-73.906 mln
-3.7%
jan 1, 1984
2.09 bln
+167.206 mln
8.69%
jan 1, 1985
1.824 bln
-266.77 mln
-12.76%
jan 1, 1986
1.271 bln
-552.289 mln
-30.29%
jan 1, 1987
1.483 bln
+211.3 mln
16.62%
jan 1, 1988
2.128 bln
+645.713 mln
43.55%
jan 1, 1989
2.094 bln
-34.065 mln
-1.6%
jan 1, 1990
2.086 bln
-7.953 mln
-0.38%
jan 1, 1991
2.235 bln
+148.359 mln
7.11%
jan 1, 1992
2.727 bln
+491.816 mln
22.01%
jan 1, 1993
3.019 bln
+292.874 mln
10.74%
jan 1, 1994
2.815 bln
-204.075 mln
-6.76%
jan 1, 1995
2.985 bln
+169.244 mln
6.01%
jan 1, 1996
3.339 bln
+354.597 mln
11.88%
jan 1, 1997
3.357 bln
+18.138 mln
0.54%
jan 1, 1998
3.68 bln
+322.779 mln
9.61%
jan 1, 1999
3.325 bln
-355.459 mln
-9.66%
jan 1, 2000
3.344 bln
+19.627 mln
0.59%
jan 1, 2001
3.384 bln
+39.569 mln
1.18%
jan 1, 2002
2.985 bln
-398.38 mln
-11.77%
jan 1, 2003
2.808 bln
-177.158 mln
-5.93%
jan 1, 2004
4.424 bln
+1.616 bln
57.54%
jan 1, 2005
5.497 bln
+1.073 bln
24.25%
jan 1, 2006
5.822 bln
+324.653 mln
5.91%
jan 1, 2007
5.891 bln
+69.107 mln
1.19%
jan 1, 2008
7.078 bln
+1.187 bln
20.15%
jan 1, 2009
7.185 bln
+107.786 mln
1.52%
jan 1, 2010
8.373 bln
+1.188 bln
16.53%
jan 1, 2011
10.016 bln
+1.643 bln
19.62%
jan 1, 2012
11.116 bln
+1.1 bln
10.98%
jan 1, 2013
11.717 bln
+601.64 mln
5.41%
jan 1, 2014
11.534 bln
-182.837 mln
-1.56%
jan 1, 2015
11.296 bln
-238.015 mln
-2.06%
jan 1, 2016
10.299 bln
-997.782 mln
-8.83%
Ranking of countries by current statistics by years


Comments: