29
/
en
AIzaSyAYiBZKx7MnpbEhh9jyipgxe19OcubqV5w
April 1, 2024
82743
Belize
BLZ
true
2
1
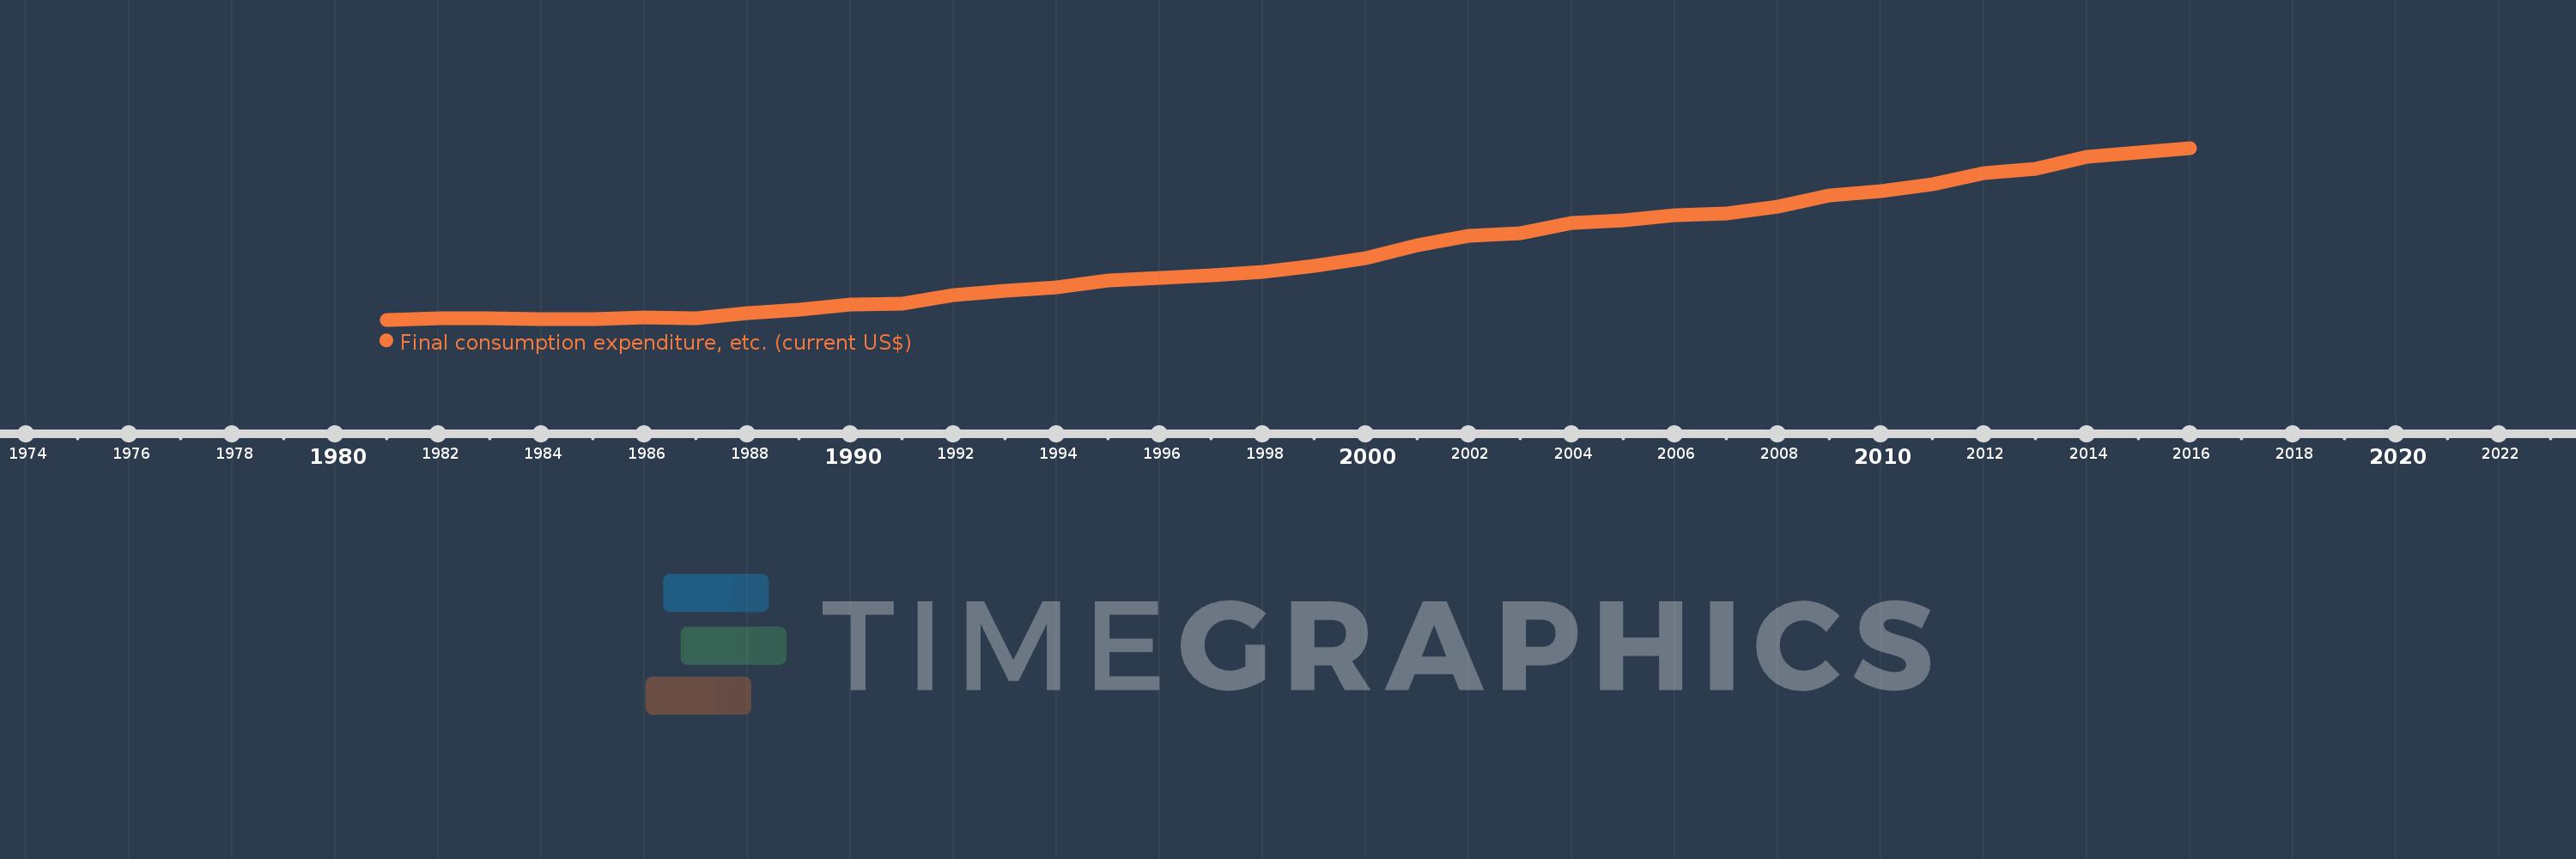
Final consumption expenditure, etc. (current US$)
2016,2015,2014,2013,2012,2011,2010,2009,2008,2007,2006,2005,2004,2003,2002,2001,2000,1999,1998,1997,1996,1995,1994,1993,1992,1991,1990,1989,1988,1987,1986,1985,1984,1983,1982,1981
This statistics in other country:
AfghanistanAlbaniaAlgeriaAngolaAntigua and BarbudaArab WorldArgentinaArmeniaArubaAustraliaAustriaAzerbaijanBahamas, TheBahrainBangladeshBarbadosBelarusBelgiumBelizeBeninBermudaBhutanBoliviaBosnia and HerzegovinaBotswanaBrazilBrunei DarussalamBulgariaBurkina FasoBurundiCabo VerdeCambodiaCameroonCanadaCaribbean small statesCentral African RepublicCentral Europe and the BalticsChadChileChinaColombiaComorosCongo, Dem. Rep.Congo, Rep.Costa RicaCote d'IvoireCroatiaCubaCyprusCzech RepublicDenmarkDjiboutiDominicaDominican RepublicEarly-demographic dividendEast Asia & PacificEast Asia & Pacific (excluding high income)East Asia & Pacific (IDA & IBRD countries)EcuadorEgypt, Arab Rep.El SalvadorEquatorial GuineaEritreaEstoniaEthiopiaEuro areaEurope & Central AsiaEurope & Central Asia (excluding high income)Europe & Central Asia (IDA & IBRD countries)European UnionFaroe IslandsFijiFinlandFragile and conflict affected situationsFranceGabonGambia, TheGeorgiaGermanyGhanaGreeceGrenadaGuatemalaGuineaGuinea-BissauGuyanaHaitiHeavily indebted poor countries (HIPC)High incomeHondurasHong Kong SAR, ChinaHungaryIBRD onlyIcelandIDA & IBRD totalIDA blendIDA onlyIDA totalIndiaIndonesiaIran, Islamic Rep.IraqIrelandIsraelItalyJamaicaJapanJordanKazakhstanKenyaKiribatiKorea, Rep.KosovoKuwaitKyrgyz RepublicLao PDRLate-demographic dividendLatin America & Caribbean Latin America & Caribbean (excluding high income)Latin America & the Caribbean (IDA & IBRD countries)LatviaLeast developed countries: UN classificationLebanonLesothoLiberiaLibyaLithuaniaLow & middle incomeLow incomeLower middle incomeLuxembourgMacao SAR, ChinaMacedonia, FYRMadagascarMalawiMalaysiaMaldivesMaliMaltaMauritaniaMauritiusMexicoMicronesia, Fed. Sts.Middle East & North AfricaMiddle East & North Africa (excluding high income)Middle East & North Africa (IDA & IBRD countries)Middle incomeMoldovaMongoliaMontenegroMoroccoMozambiqueNamibiaNepalNetherlandsNew CaledoniaNew ZealandNicaraguaNigerNigeriaNorth AmericaNorwayOECD membersOmanOther small statesPakistanPanamaPapua New GuineaParaguayPeruPhilippinesPolandPortugalPost-demographic dividendPre-demographic dividendPuerto RicoQatarRomaniaRussian FederationRwandaSaudi ArabiaSenegalSerbiaSeychellesSierra LeoneSingaporeSlovak RepublicSloveniaSmall statesSolomon IslandsSouth AfricaSouth AsiaSouth Asia (IDA & IBRD)South SudanSpainSri LankaSt. Kitts and NevisSt. LuciaSt. Vincent and the GrenadinesSub-Saharan Africa Sub-Saharan Africa (excluding high income)Sub-Saharan Africa (IDA & IBRD countries)SudanSurinameSwazilandSwedenSwitzerlandSyrian Arab RepublicTajikistanTanzaniaThailandTimor-LesteTogoTongaTrinidad and TobagoTunisiaTurkeyTurkmenistanUgandaUkraineUnited Arab EmiratesUnited KingdomUnited StatesUpper middle incomeUruguayUzbekistanVanuatuVenezuela, RBVietnamWest Bank and GazaWorldYemen, Rep.ZambiaZimbabwe Timeline:
This timeline shows a graph from 1981 to 2016 of Belize. No data until 1980. Number of actual observations by date: 36.
Source name:
World Development Indicators
Source organization:
World Bank national accounts data, and OECD National Accounts data files.
Categories, topics:
Economy & Growth
Last updated:
apr 23, 2017
Indicators value changes by year
Minimum:
173.5 mln
jan 1, 1981
Maximum:
1.487 bln
jan 1, 2016
At the date of observation
Value
Absolute change
Change from previous value
jan 1, 1981
173.5 mln
+173.5 mln
0.0%
jan 1, 1982
185.0 mln
+11.5 mln
6.63%
jan 1, 1983
182.55 mln
-2.45 mln
-1.32%
jan 1, 1984
180.9 mln
-1.65 mln
-0.9%
jan 1, 1985
177.5 mln
-3.4 mln
-1.88%
jan 1, 1986
190.75 mln
+13.25 mln
7.46%
jan 1, 1987
187.4 mln
-3.35 mln
-1.76%
jan 1, 1988
221.8 mln
+34.4 mln
18.36%
jan 1, 1989
253.35 mln
+31.55 mln
14.22%
jan 1, 1990
287.25 mln
+33.9 mln
13.38%
jan 1, 1991
298.2 mln
+10.95 mln
3.81%
jan 1, 1992
360.271 mln
+62.071 mln
20.82%
jan 1, 1993
396.822 mln
+36.551 mln
10.15%
jan 1, 1994
419.967 mln
+23.146 mln
5.83%
jan 1, 1995
476.624 mln
+56.656 mln
13.49%
jan 1, 1996
492.656 mln
+16.032 mln
3.36%
jan 1, 1997
512.531 mln
+19.875 mln
4.03%
jan 1, 1998
541.492 mln
+28.961 mln
5.65%
jan 1, 1999
587.55 mln
+46.058 mln
8.51%
jan 1, 2000
642.685 mln
+55.135 mln
9.38%
jan 1, 2001
740.481 mln
+97.796 mln
15.22%
jan 1, 2002
814.704 mln
+74.224 mln
10.02%
jan 1, 2003
836.853 mln
+22.149 mln
2.72%
jan 1, 2004
913.699 mln
+76.846 mln
9.18%
jan 1, 2005
935.137 mln
+21.438 mln
2.35%
jan 1, 2006
970.639 mln
+35.502 mln
3.8%
jan 1, 2007
988.684 mln
+18.044 mln
1.86%
jan 1, 2008
1.039 bln
+50.401 mln
5.1%
jan 1, 2009
1.126 bln
+86.476 mln
8.32%
jan 1, 2010
1.154 bln
+28.222 mln
2.51%
jan 1, 2011
1.211 bln
+57.714 mln
5.0%
jan 1, 2012
1.292 bln
+80.332 mln
6.63%
jan 1, 2013
1.33 bln
+37.958 mln
2.94%
jan 1, 2014
1.42 bln
+89.967 mln
6.77%
jan 1, 2015
1.452 bln
+32.734 mln
2.31%
jan 1, 2016
1.487 bln
+34.018 mln
2.34%
Ranking of countries by current statistics by years


Comments: