29
/
en
AIzaSyAYiBZKx7MnpbEhh9jyipgxe19OcubqV5w
April 1, 2024
32577
Europe & Central Asia (IDA & IBRD countries)
TEC
false
2
1
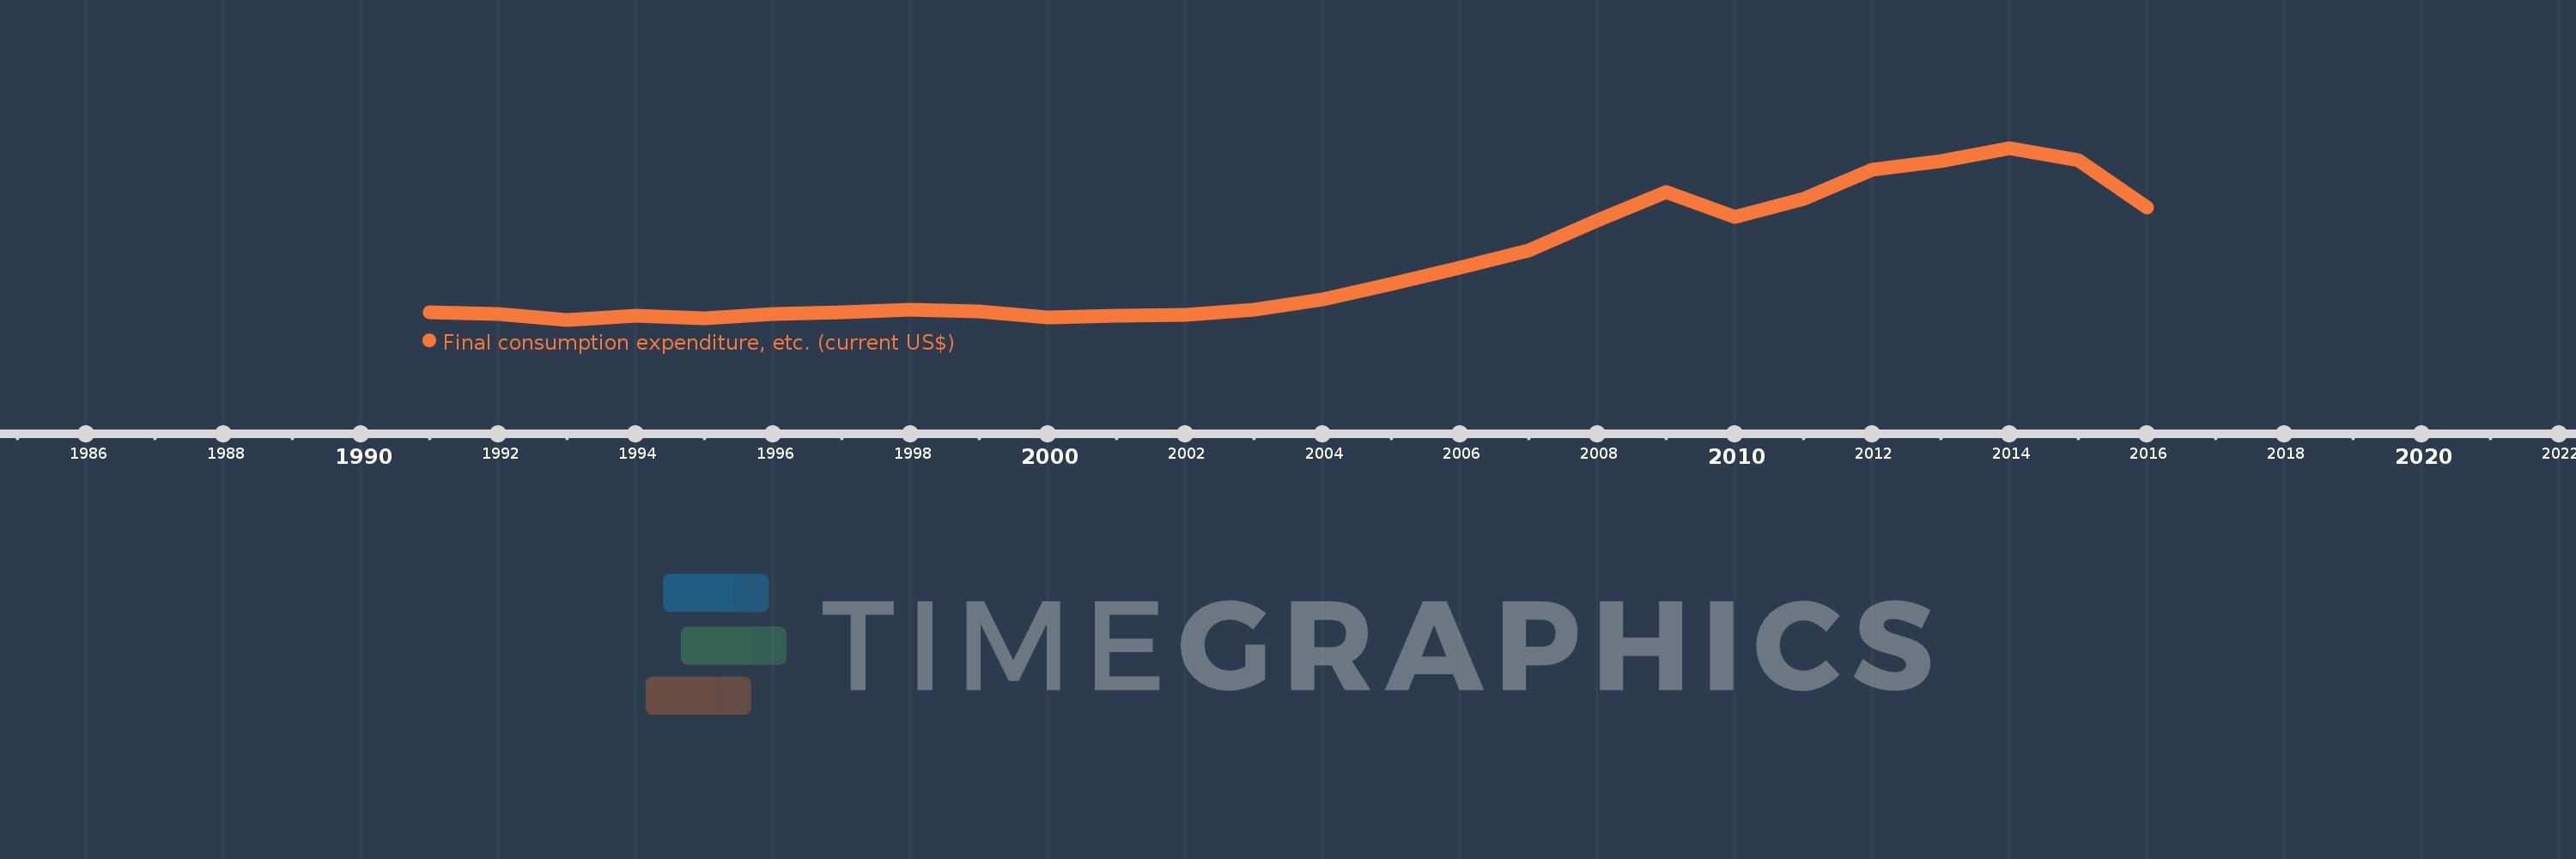
Final consumption expenditure, etc. (current US$)
2016,2015,2014,2013,2012,2011,2010,2009,2008,2007,2006,2005,2004,2003,2002,2001,2000,1999,1998,1997,1996,1995,1994,1993,1992,1991
This statistics in other country:
AfghanistanAlbaniaAlgeriaAngolaAntigua and BarbudaArab WorldArgentinaArmeniaArubaAustraliaAustriaAzerbaijanBahamas, TheBahrainBangladeshBarbadosBelarusBelgiumBelizeBeninBermudaBhutanBoliviaBosnia and HerzegovinaBotswanaBrazilBrunei DarussalamBulgariaBurkina FasoBurundiCabo VerdeCambodiaCameroonCanadaCaribbean small statesCentral African RepublicCentral Europe and the BalticsChadChileChinaColombiaComorosCongo, Dem. Rep.Congo, Rep.Costa RicaCote d'IvoireCroatiaCubaCyprusCzech RepublicDenmarkDjiboutiDominicaDominican RepublicEarly-demographic dividendEast Asia & PacificEast Asia & Pacific (excluding high income)East Asia & Pacific (IDA & IBRD countries)EcuadorEgypt, Arab Rep.El SalvadorEquatorial GuineaEritreaEstoniaEthiopiaEuro areaEurope & Central AsiaEurope & Central Asia (excluding high income)Europe & Central Asia (IDA & IBRD countries)European UnionFaroe IslandsFijiFinlandFragile and conflict affected situationsFranceGabonGambia, TheGeorgiaGermanyGhanaGreeceGrenadaGuatemalaGuineaGuinea-BissauGuyanaHaitiHeavily indebted poor countries (HIPC)High incomeHondurasHong Kong SAR, ChinaHungaryIBRD onlyIcelandIDA & IBRD totalIDA blendIDA onlyIDA totalIndiaIndonesiaIran, Islamic Rep.IraqIrelandIsraelItalyJamaicaJapanJordanKazakhstanKenyaKiribatiKorea, Rep.KosovoKuwaitKyrgyz RepublicLao PDRLate-demographic dividendLatin America & Caribbean Latin America & Caribbean (excluding high income)Latin America & the Caribbean (IDA & IBRD countries)LatviaLeast developed countries: UN classificationLebanonLesothoLiberiaLibyaLithuaniaLow & middle incomeLow incomeLower middle incomeLuxembourgMacao SAR, ChinaMacedonia, FYRMadagascarMalawiMalaysiaMaldivesMaliMaltaMauritaniaMauritiusMexicoMicronesia, Fed. Sts.Middle East & North AfricaMiddle East & North Africa (excluding high income)Middle East & North Africa (IDA & IBRD countries)Middle incomeMoldovaMongoliaMontenegroMoroccoMozambiqueNamibiaNepalNetherlandsNew CaledoniaNew ZealandNicaraguaNigerNigeriaNorth AmericaNorwayOECD membersOmanOther small statesPakistanPanamaPapua New GuineaParaguayPeruPhilippinesPolandPortugalPost-demographic dividendPre-demographic dividendPuerto RicoQatarRomaniaRussian FederationRwandaSaudi ArabiaSenegalSerbiaSeychellesSierra LeoneSingaporeSlovak RepublicSloveniaSmall statesSolomon IslandsSouth AfricaSouth AsiaSouth Asia (IDA & IBRD)South SudanSpainSri LankaSt. Kitts and NevisSt. LuciaSt. Vincent and the GrenadinesSub-Saharan Africa Sub-Saharan Africa (excluding high income)Sub-Saharan Africa (IDA & IBRD countries)SudanSurinameSwazilandSwedenSwitzerlandSyrian Arab RepublicTajikistanTanzaniaThailandTimor-LesteTogoTongaTrinidad and TobagoTunisiaTurkeyTurkmenistanUgandaUkraineUnited Arab EmiratesUnited KingdomUnited StatesUpper middle incomeUruguayUzbekistanVanuatuVenezuela, RBVietnamWest Bank and GazaWorldYemen, Rep.ZambiaZimbabwe Timeline:
This timeline shows a graph from 1991 to 2016 of Europe & Central Asia (IDA & IBRD countries). No data until 1990. Number of actual observations by date: 26.
Source name:
World Development Indicators
Source organization:
World Bank national accounts data, and OECD National Accounts data files.
Categories, topics:
Economy & Growth
Last updated:
apr 23, 2017
Indicators value changes by year
Minimum:
609.329 bln
jan 1, 1993
Maximum:
3.597 trl
jan 1, 2014
At the date of observation
Value
Absolute change
Change from previous value
jan 1, 1991
741.577 bln
+741.577 bln
0.0%
jan 1, 1992
712.726 bln
-28.851 bln
-3.89%
jan 1, 1993
609.329 bln
-103.398 bln
-14.51%
jan 1, 1994
678.794 bln
+69.465 bln
11.4%
jan 1, 1995
629.708 bln
-49.086 bln
-7.23%
jan 1, 1996
702.613 bln
+72.905 bln
11.58%
jan 1, 1997
739.894 bln
+37.281 bln
5.31%
jan 1, 1998
780.769 bln
+40.875 bln
5.52%
jan 1, 1999
752.101 bln
-28.668 bln
-3.67%
jan 1, 2000
642.974 bln
-109.127 bln
-14.51%
jan 1, 2001
673.606 bln
+30.632 bln
4.76%
jan 1, 2002
690.921 bln
+17.315 bln
2.57%
jan 1, 2003
791.098 bln
+100.177 bln
14.5%
jan 1, 2004
970.259 bln
+179.161 bln
22.65%
jan 1, 2005
1.232 trl
+261.433 bln
26.94%
jan 1, 2006
1.524 trl
+291.815 bln
23.69%
jan 1, 2007
1.813 trl
+289.694 bln
19.01%
jan 1, 2008
2.335 trl
+521.54 bln
28.76%
jan 1, 2009
2.83 trl
+495.359 bln
21.22%
jan 1, 2010
2.393 trl
-436.837 bln
-15.44%
jan 1, 2011
2.718 trl
+324.595 bln
13.56%
jan 1, 2012
3.217 trl
+498.869 bln
18.36%
jan 1, 2013
3.367 trl
+150.514 bln
4.68%
jan 1, 2014
3.597 trl
+229.91 bln
6.83%
jan 1, 2015
3.379 trl
-218.308 bln
-6.07%
jan 1, 2016
2.563 trl
-815.851 bln
-24.15%
Ranking of countries by current statistics by years


Comments: