29
/
en
AIzaSyAYiBZKx7MnpbEhh9jyipgxe19OcubqV5w
April 1, 2024
255138
Swaziland
SWZ
true
2
1
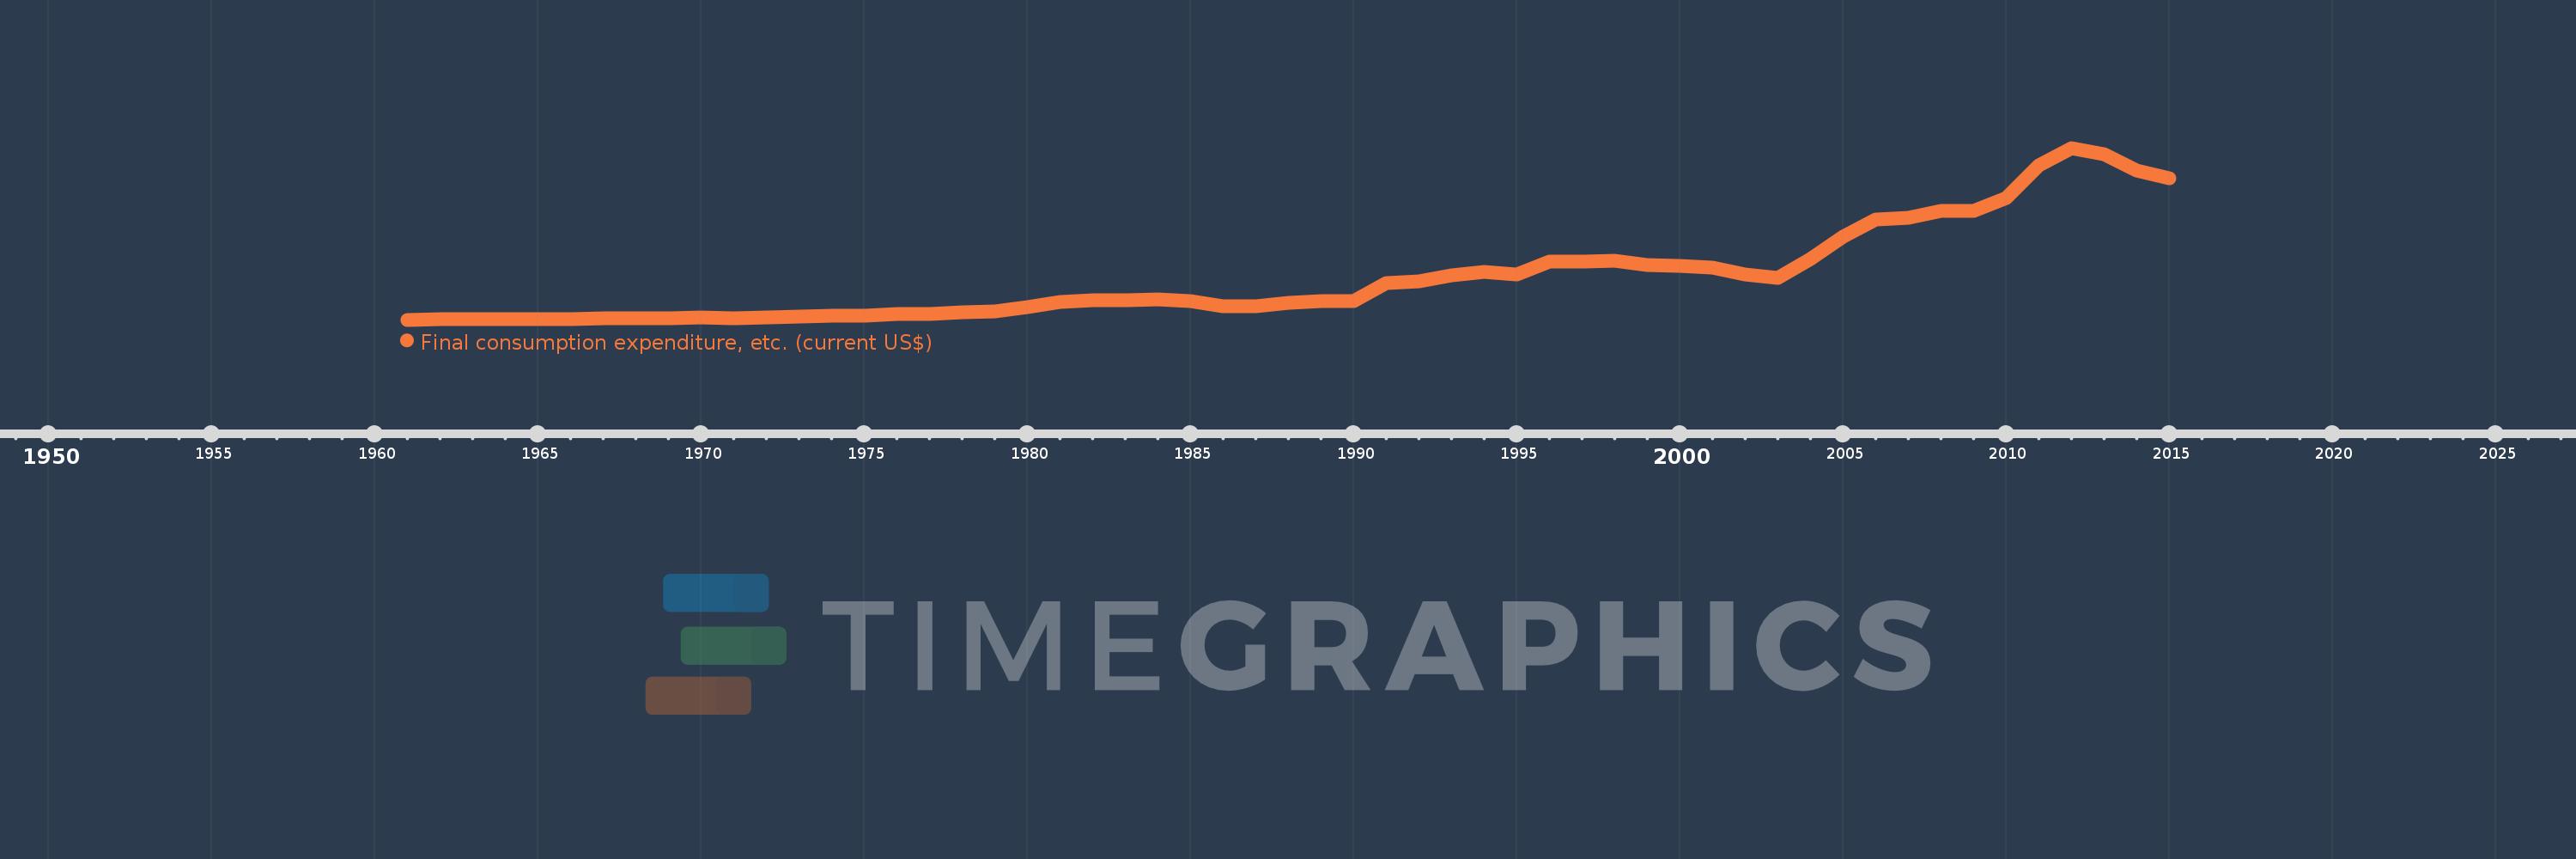
Final consumption expenditure, etc. (current US$)
2015,2014,2013,2012,2011,2010,2009,2008,2007,2006,2005,2004,2003,2002,2001,2000,1999,1998,1997,1996,1995,1994,1993,1992,1991,1990,1989,1988,1987,1986,1985,1984,1983,1982,1981,1980,1979,1978,1977,1976,1975,1974,1973,1972,1971,1970,1969,1968,1967,1966,1965,1964,1963,1962,1961
This statistics in other country:
AfghanistanAlbaniaAlgeriaAngolaAntigua and BarbudaArab WorldArgentinaArmeniaArubaAustraliaAustriaAzerbaijanBahamas, TheBahrainBangladeshBarbadosBelarusBelgiumBelizeBeninBermudaBhutanBoliviaBosnia and HerzegovinaBotswanaBrazilBrunei DarussalamBulgariaBurkina FasoBurundiCabo VerdeCambodiaCameroonCanadaCaribbean small statesCentral African RepublicCentral Europe and the BalticsChadChileChinaColombiaComorosCongo, Dem. Rep.Congo, Rep.Costa RicaCote d'IvoireCroatiaCubaCyprusCzech RepublicDenmarkDjiboutiDominicaDominican RepublicEarly-demographic dividendEast Asia & PacificEast Asia & Pacific (excluding high income)East Asia & Pacific (IDA & IBRD countries)EcuadorEgypt, Arab Rep.El SalvadorEquatorial GuineaEritreaEstoniaEthiopiaEuro areaEurope & Central AsiaEurope & Central Asia (excluding high income)Europe & Central Asia (IDA & IBRD countries)European UnionFaroe IslandsFijiFinlandFragile and conflict affected situationsFranceGabonGambia, TheGeorgiaGermanyGhanaGreeceGrenadaGuatemalaGuineaGuinea-BissauGuyanaHaitiHeavily indebted poor countries (HIPC)High incomeHondurasHong Kong SAR, ChinaHungaryIBRD onlyIcelandIDA & IBRD totalIDA blendIDA onlyIDA totalIndiaIndonesiaIran, Islamic Rep.IraqIrelandIsraelItalyJamaicaJapanJordanKazakhstanKenyaKiribatiKorea, Rep.KosovoKuwaitKyrgyz RepublicLao PDRLate-demographic dividendLatin America & Caribbean Latin America & Caribbean (excluding high income)Latin America & the Caribbean (IDA & IBRD countries)LatviaLeast developed countries: UN classificationLebanonLesothoLiberiaLibyaLithuaniaLow & middle incomeLow incomeLower middle incomeLuxembourgMacao SAR, ChinaMacedonia, FYRMadagascarMalawiMalaysiaMaldivesMaliMaltaMauritaniaMauritiusMexicoMicronesia, Fed. Sts.Middle East & North AfricaMiddle East & North Africa (excluding high income)Middle East & North Africa (IDA & IBRD countries)Middle incomeMoldovaMongoliaMontenegroMoroccoMozambiqueNamibiaNepalNetherlandsNew CaledoniaNew ZealandNicaraguaNigerNigeriaNorth AmericaNorwayOECD membersOmanOther small statesPakistanPanamaPapua New GuineaParaguayPeruPhilippinesPolandPortugalPost-demographic dividendPre-demographic dividendPuerto RicoQatarRomaniaRussian FederationRwandaSaudi ArabiaSenegalSerbiaSeychellesSierra LeoneSingaporeSlovak RepublicSloveniaSmall statesSolomon IslandsSouth AfricaSouth AsiaSouth Asia (IDA & IBRD)South SudanSpainSri LankaSt. Kitts and NevisSt. LuciaSt. Vincent and the GrenadinesSub-Saharan Africa Sub-Saharan Africa (excluding high income)Sub-Saharan Africa (IDA & IBRD countries)SudanSurinameSwazilandSwedenSwitzerlandSyrian Arab RepublicTajikistanTanzaniaThailandTimor-LesteTogoTongaTrinidad and TobagoTunisiaTurkeyTurkmenistanUgandaUkraineUnited Arab EmiratesUnited KingdomUnited StatesUpper middle incomeUruguayUzbekistanVanuatuVenezuela, RBVietnamWest Bank and GazaWorldYemen, Rep.ZambiaZimbabwe Timeline:
This timeline shows a graph from 1961 to 2015 of Swaziland. No data until 1960. Number of actual observations by date: 55.
Source name:
World Development Indicators
Source organization:
World Bank national accounts data, and OECD National Accounts data files.
Categories, topics:
Economy & Growth
Last updated:
apr 23, 2017
Indicators value changes by year
Minimum:
23.456 mln
jan 1, 1961
Maximum:
4.861 bln
jan 1, 2012
At the date of observation
Value
Absolute change
Change from previous value
jan 1, 1961
23.456 mln
+23.456 mln
0.0%
jan 1, 1962
29.865 mln
+6.409 mln
27.32%
jan 1, 1963
30.387 mln
+521.91K
1.75%
jan 1, 1964
32.149 mln
+1.761 mln
5.8%
jan 1, 1965
35.3 mln
+3.151 mln
9.8%
jan 1, 1966
40.739 mln
+5.439 mln
15.41%
jan 1, 1967
56.839 mln
+16.1 mln
39.52%
jan 1, 1968
65.239 mln
+8.4 mln
14.78%
jan 1, 1969
61.319 mln
-3.92 mln
-6.01%
jan 1, 1970
76.858 mln
+15.54 mln
25.34%
jan 1, 1971
75.58 mln
-1.278 mln
-1.66%
jan 1, 1972
91.704 mln
+16.123 mln
21.33%
jan 1, 1973
103.009 mln
+11.306 mln
12.33%
jan 1, 1974
145.646 mln
+42.637 mln
41.39%
jan 1, 1975
142.414 mln
-3.232 mln
-2.22%
jan 1, 1976
188.501 mln
+46.087 mln
32.36%
jan 1, 1977
189.972 mln
+1.472 mln
0.78%
jan 1, 1978
232.061 mln
+42.088 mln
22.15%
jan 1, 1979
258.28 mln
+26.219 mln
11.3%
jan 1, 1980
385.84 mln
+127.56 mln
49.39%
jan 1, 1981
535.452 mln
+149.612 mln
38.78%
jan 1, 1982
569.261 mln
+33.809 mln
6.31%
jan 1, 1983
564.828 mln
-4.433 mln
-0.78%
jan 1, 1984
586.034 mln
+21.206 mln
3.75%
jan 1, 1985
536.704 mln
-49.329 mln
-8.42%
jan 1, 1986
396.945 mln
-139.759 mln
-26.04%
jan 1, 1987
408.928 mln
+11.982 mln
3.02%
jan 1, 1988
498.87 mln
+89.943 mln
21.99%
jan 1, 1989
552.584 mln
+53.714 mln
10.77%
jan 1, 1990
549.51 mln
-3.074 mln
-0.56%
jan 1, 1991
1.056 bln
+506.618 mln
92.19%
jan 1, 1992
1.107 bln
+50.623 mln
4.79%
jan 1, 1993
1.272 bln
+165.497 mln
14.95%
jan 1, 1994
1.371 bln
+99.002 mln
7.78%
jan 1, 1995
1.303 bln
-67.885 mln
-4.95%
jan 1, 1996
1.66 bln
+356.687 mln
27.37%
jan 1, 1997
1.671 bln
+10.746 mln
0.65%
jan 1, 1998
1.675 bln
+4.418 mln
0.26%
jan 1, 1999
1.553 bln
-121.98 mln
-7.28%
jan 1, 2000
1.542 bln
-11.7 mln
-0.75%
jan 1, 2001
1.494 bln
-47.648 mln
-3.09%
jan 1, 2002
1.296 bln
-197.472 mln
-13.22%
jan 1, 2003
1.199 bln
-97.251 mln
-7.5%
jan 1, 2004
1.737 bln
+537.723 mln
44.84%
jan 1, 2005
2.358 bln
+620.684 mln
35.74%
jan 1, 2006
2.846 bln
+488.819 mln
20.73%
jan 1, 2007
2.891 bln
+44.99 mln
1.58%
jan 1, 2008
3.076 bln
+184.889 mln
6.39%
jan 1, 2009
3.098 bln
+21.671 mln
0.7%
jan 1, 2010
3.461 bln
+362.846 mln
11.71%
jan 1, 2011
4.369 bln
+908.316 mln
26.25%
jan 1, 2012
4.861 bln
+491.529 mln
11.25%
jan 1, 2013
4.674 bln
-186.376 mln
-3.83%
jan 1, 2014
4.229 bln
-445.04 mln
-9.52%
jan 1, 2015
4.007 bln
-222.409 mln
-5.26%
Ranking of countries by current statistics by years


Comments: