29
/
en
AIzaSyAYiBZKx7MnpbEhh9jyipgxe19OcubqV5w
April 1, 2024
126139
El Salvador
SLV
true
2
1
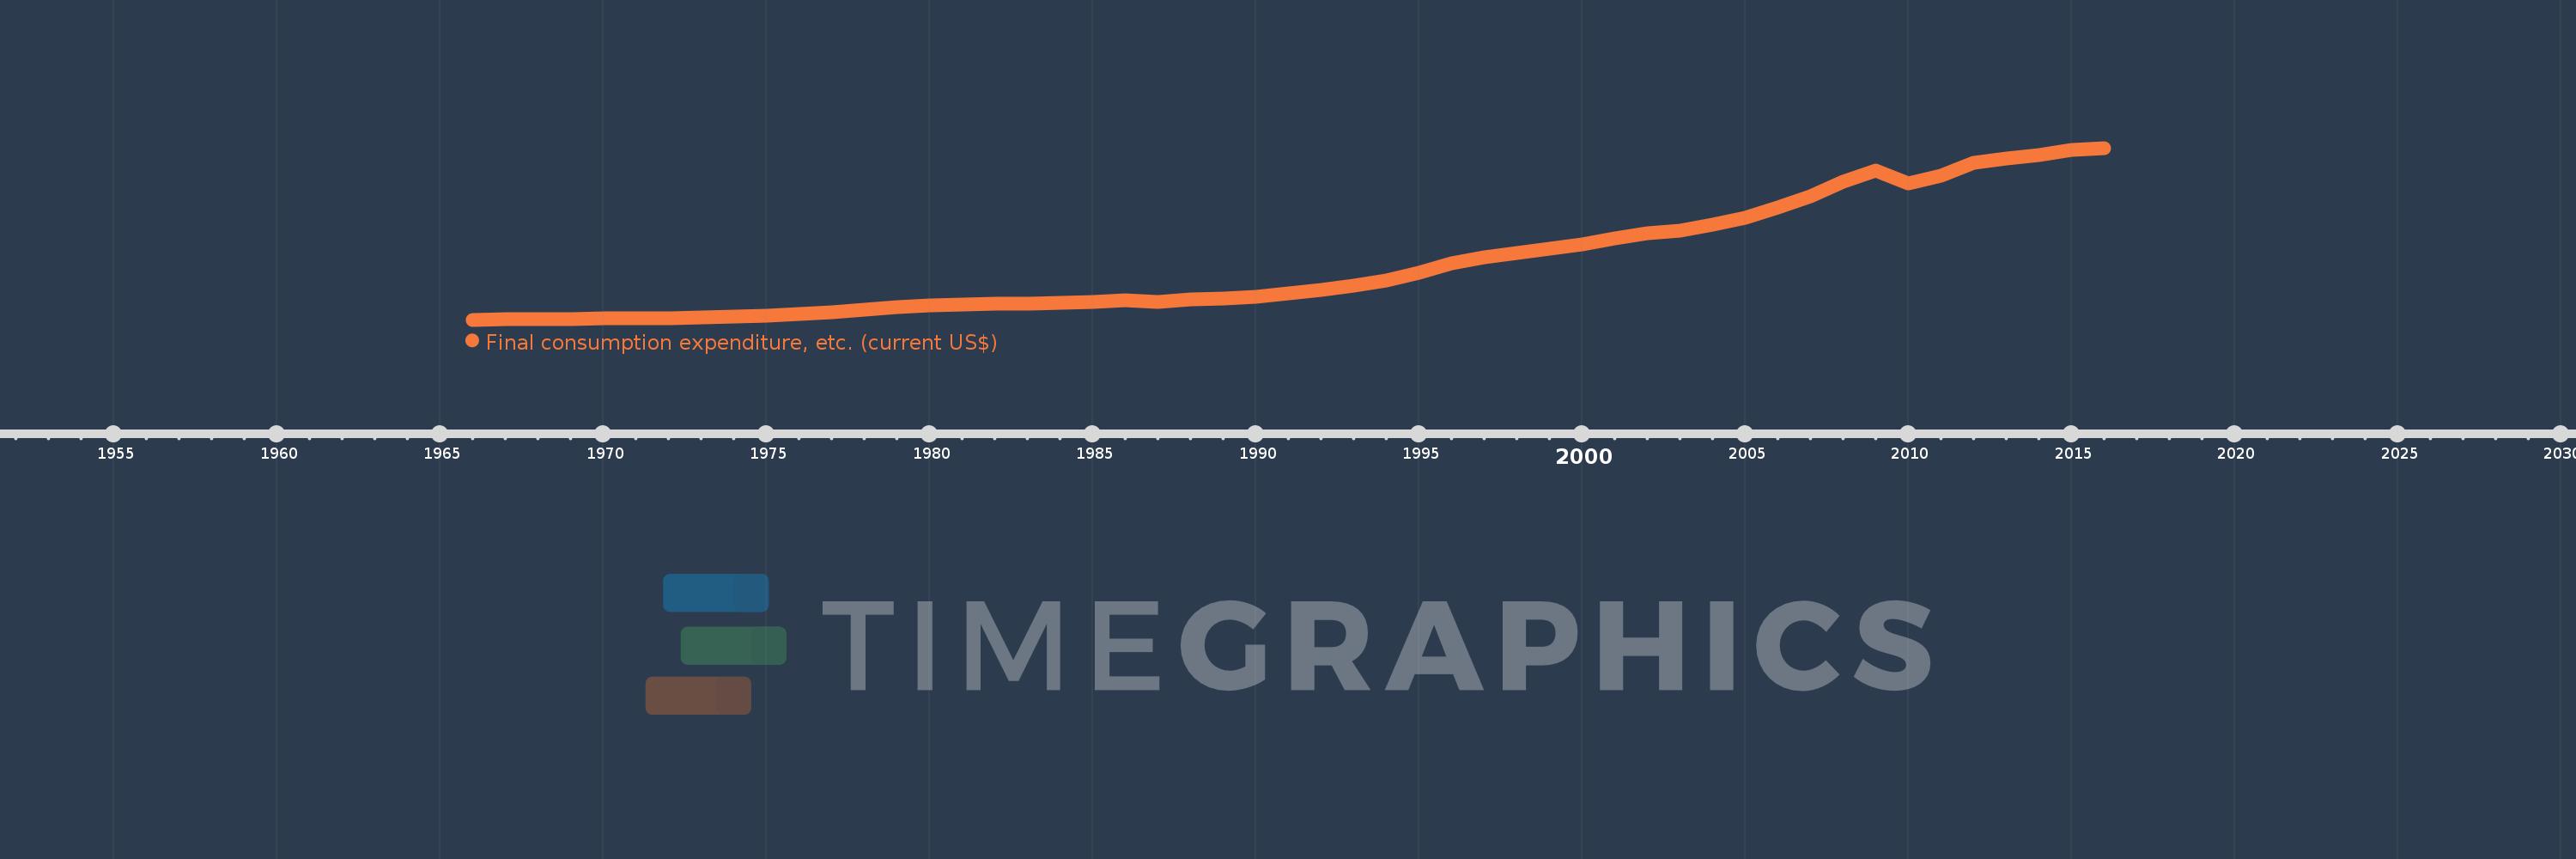
Final consumption expenditure, etc. (current US$)
2016,2015,2014,2013,2012,2011,2010,2009,2008,2007,2006,2005,2004,2003,2002,2001,2000,1999,1998,1997,1996,1995,1994,1993,1992,1991,1990,1989,1988,1987,1986,1985,1984,1983,1982,1981,1980,1979,1978,1977,1976,1975,1974,1973,1972,1971,1970,1969,1968,1967,1966
This statistics in other country:
AfghanistanAlbaniaAlgeriaAngolaAntigua and BarbudaArab WorldArgentinaArmeniaArubaAustraliaAustriaAzerbaijanBahamas, TheBahrainBangladeshBarbadosBelarusBelgiumBelizeBeninBermudaBhutanBoliviaBosnia and HerzegovinaBotswanaBrazilBrunei DarussalamBulgariaBurkina FasoBurundiCabo VerdeCambodiaCameroonCanadaCaribbean small statesCentral African RepublicCentral Europe and the BalticsChadChileChinaColombiaComorosCongo, Dem. Rep.Congo, Rep.Costa RicaCote d'IvoireCroatiaCubaCyprusCzech RepublicDenmarkDjiboutiDominicaDominican RepublicEarly-demographic dividendEast Asia & PacificEast Asia & Pacific (excluding high income)East Asia & Pacific (IDA & IBRD countries)EcuadorEgypt, Arab Rep.El SalvadorEquatorial GuineaEritreaEstoniaEthiopiaEuro areaEurope & Central AsiaEurope & Central Asia (excluding high income)Europe & Central Asia (IDA & IBRD countries)European UnionFaroe IslandsFijiFinlandFragile and conflict affected situationsFranceGabonGambia, TheGeorgiaGermanyGhanaGreeceGrenadaGuatemalaGuineaGuinea-BissauGuyanaHaitiHeavily indebted poor countries (HIPC)High incomeHondurasHong Kong SAR, ChinaHungaryIBRD onlyIcelandIDA & IBRD totalIDA blendIDA onlyIDA totalIndiaIndonesiaIran, Islamic Rep.IraqIrelandIsraelItalyJamaicaJapanJordanKazakhstanKenyaKiribatiKorea, Rep.KosovoKuwaitKyrgyz RepublicLao PDRLate-demographic dividendLatin America & Caribbean Latin America & Caribbean (excluding high income)Latin America & the Caribbean (IDA & IBRD countries)LatviaLeast developed countries: UN classificationLebanonLesothoLiberiaLibyaLithuaniaLow & middle incomeLow incomeLower middle incomeLuxembourgMacao SAR, ChinaMacedonia, FYRMadagascarMalawiMalaysiaMaldivesMaliMaltaMauritaniaMauritiusMexicoMicronesia, Fed. Sts.Middle East & North AfricaMiddle East & North Africa (excluding high income)Middle East & North Africa (IDA & IBRD countries)Middle incomeMoldovaMongoliaMontenegroMoroccoMozambiqueNamibiaNepalNetherlandsNew CaledoniaNew ZealandNicaraguaNigerNigeriaNorth AmericaNorwayOECD membersOmanOther small statesPakistanPanamaPapua New GuineaParaguayPeruPhilippinesPolandPortugalPost-demographic dividendPre-demographic dividendPuerto RicoQatarRomaniaRussian FederationRwandaSaudi ArabiaSenegalSerbiaSeychellesSierra LeoneSingaporeSlovak RepublicSloveniaSmall statesSolomon IslandsSouth AfricaSouth AsiaSouth Asia (IDA & IBRD)South SudanSpainSri LankaSt. Kitts and NevisSt. LuciaSt. Vincent and the GrenadinesSub-Saharan Africa Sub-Saharan Africa (excluding high income)Sub-Saharan Africa (IDA & IBRD countries)SudanSurinameSwazilandSwedenSwitzerlandSyrian Arab RepublicTajikistanTanzaniaThailandTimor-LesteTogoTongaTrinidad and TobagoTunisiaTurkeyTurkmenistanUgandaUkraineUnited Arab EmiratesUnited KingdomUnited StatesUpper middle incomeUruguayUzbekistanVanuatuVenezuela, RBVietnamWest Bank and GazaWorldYemen, Rep.ZambiaZimbabwe Timeline:
This timeline shows a graph from 1966 to 2016 of El Salvador. No data until 1965. Number of actual observations by date: 51.
Source name:
World Development Indicators
Source organization:
World Bank national accounts data, and OECD National Accounts data files.
Categories, topics:
Economy & Growth
Last updated:
apr 23, 2017
Indicators value changes by year
Minimum:
765.76 mln
jan 1, 1966
Maximum:
26.39 bln
jan 1, 2016
At the date of observation
Value
Absolute change
Change from previous value
jan 1, 1966
765.76 mln
+765.76 mln
0.0%
jan 1, 1967
823.0 mln
+57.24 mln
7.47%
jan 1, 1968
861.48 mln
+38.48 mln
4.68%
jan 1, 1969
910.96 mln
+49.48 mln
5.74%
jan 1, 1970
939.16 mln
+28.2 mln
3.1%
jan 1, 1971
979.6 mln
+40.44 mln
4.31%
jan 1, 1972
1.025 bln
+45.08 mln
4.6%
jan 1, 1973
1.072 bln
+47.8 mln
4.66%
jan 1, 1974
1.222 bln
+149.8 mln
13.97%
jan 1, 1975
1.429 bln
+206.84 mln
16.92%
jan 1, 1976
1.565 bln
+135.6 mln
9.49%
jan 1, 1977
1.901 bln
+336.4 mln
21.5%
jan 1, 1978
2.232 bln
+331.36 mln
17.43%
jan 1, 1979
2.602 bln
+369.64 mln
16.56%
jan 1, 1980
2.843 bln
+241.0 mln
9.26%
jan 1, 1981
3.067 bln
+223.68 mln
7.87%
jan 1, 1982
3.185 bln
+118.28 mln
3.86%
jan 1, 1983
3.143 bln
-41.798 mln
-1.31%
jan 1, 1984
3.274 bln
+130.442 mln
4.15%
jan 1, 1985
3.472 bln
+198.356 mln
6.06%
jan 1, 1986
3.676 bln
+203.53 mln
5.86%
jan 1, 1987
3.437 bln
-238.62 mln
-6.49%
jan 1, 1988
3.75 bln
+313.202 mln
9.11%
jan 1, 1989
3.925 bln
+174.997 mln
4.67%
jan 1, 1990
4.159 bln
+233.889 mln
5.96%
jan 1, 1991
4.744 bln
+584.723 mln
14.06%
jan 1, 1992
5.199 bln
+455.6 mln
9.6%
jan 1, 1993
5.825 bln
+625.3 mln
12.03%
jan 1, 1994
6.672 bln
+847.7 mln
14.55%
jan 1, 1995
7.726 bln
+1.053 bln
15.79%
jan 1, 1996
9.128 bln
+1.402 bln
18.15%
jan 1, 1997
10.075 bln
+947.3 mln
10.38%
jan 1, 1998
10.75 bln
+674.7 mln
6.7%
jan 1, 1999
11.377 bln
+627.0 mln
5.83%
jan 1, 2000
11.956 bln
+579.3 mln
5.09%
jan 1, 2001
12.886 bln
+929.5 mln
7.77%
jan 1, 2002
13.693 bln
+807.3 mln
6.27%
jan 1, 2003
14.067 bln
+374.0 mln
2.73%
jan 1, 2004
14.885 bln
+818.2 mln
5.82%
jan 1, 2005
15.978 bln
+1.093 bln
7.34%
jan 1, 2006
17.511 bln
+1.533 bln
9.6%
jan 1, 2007
19.229 bln
+1.718 bln
9.81%
jan 1, 2008
21.331 bln
+2.103 bln
10.93%
jan 1, 2009
23.063 bln
+1.732 bln
8.12%
jan 1, 2010
21.083 bln
-1.98 bln
-8.58%
jan 1, 2011
22.19 bln
+1.106 bln
5.25%
jan 1, 2012
24.139 bln
+1.949 bln
8.78%
jan 1, 2013
24.84 bln
+701.5 mln
2.91%
jan 1, 2014
25.385 bln
+544.5 mln
2.19%
jan 1, 2015
26.107 bln
+721.9 mln
2.84%
jan 1, 2016
26.39 bln
+283.2 mln
1.08%
Ranking of countries by current statistics by years


Comments: