29
/
en
AIzaSyAYiBZKx7MnpbEhh9jyipgxe19OcubqV5w
April 1, 2024
161437
Italy
ITA
true
2
1
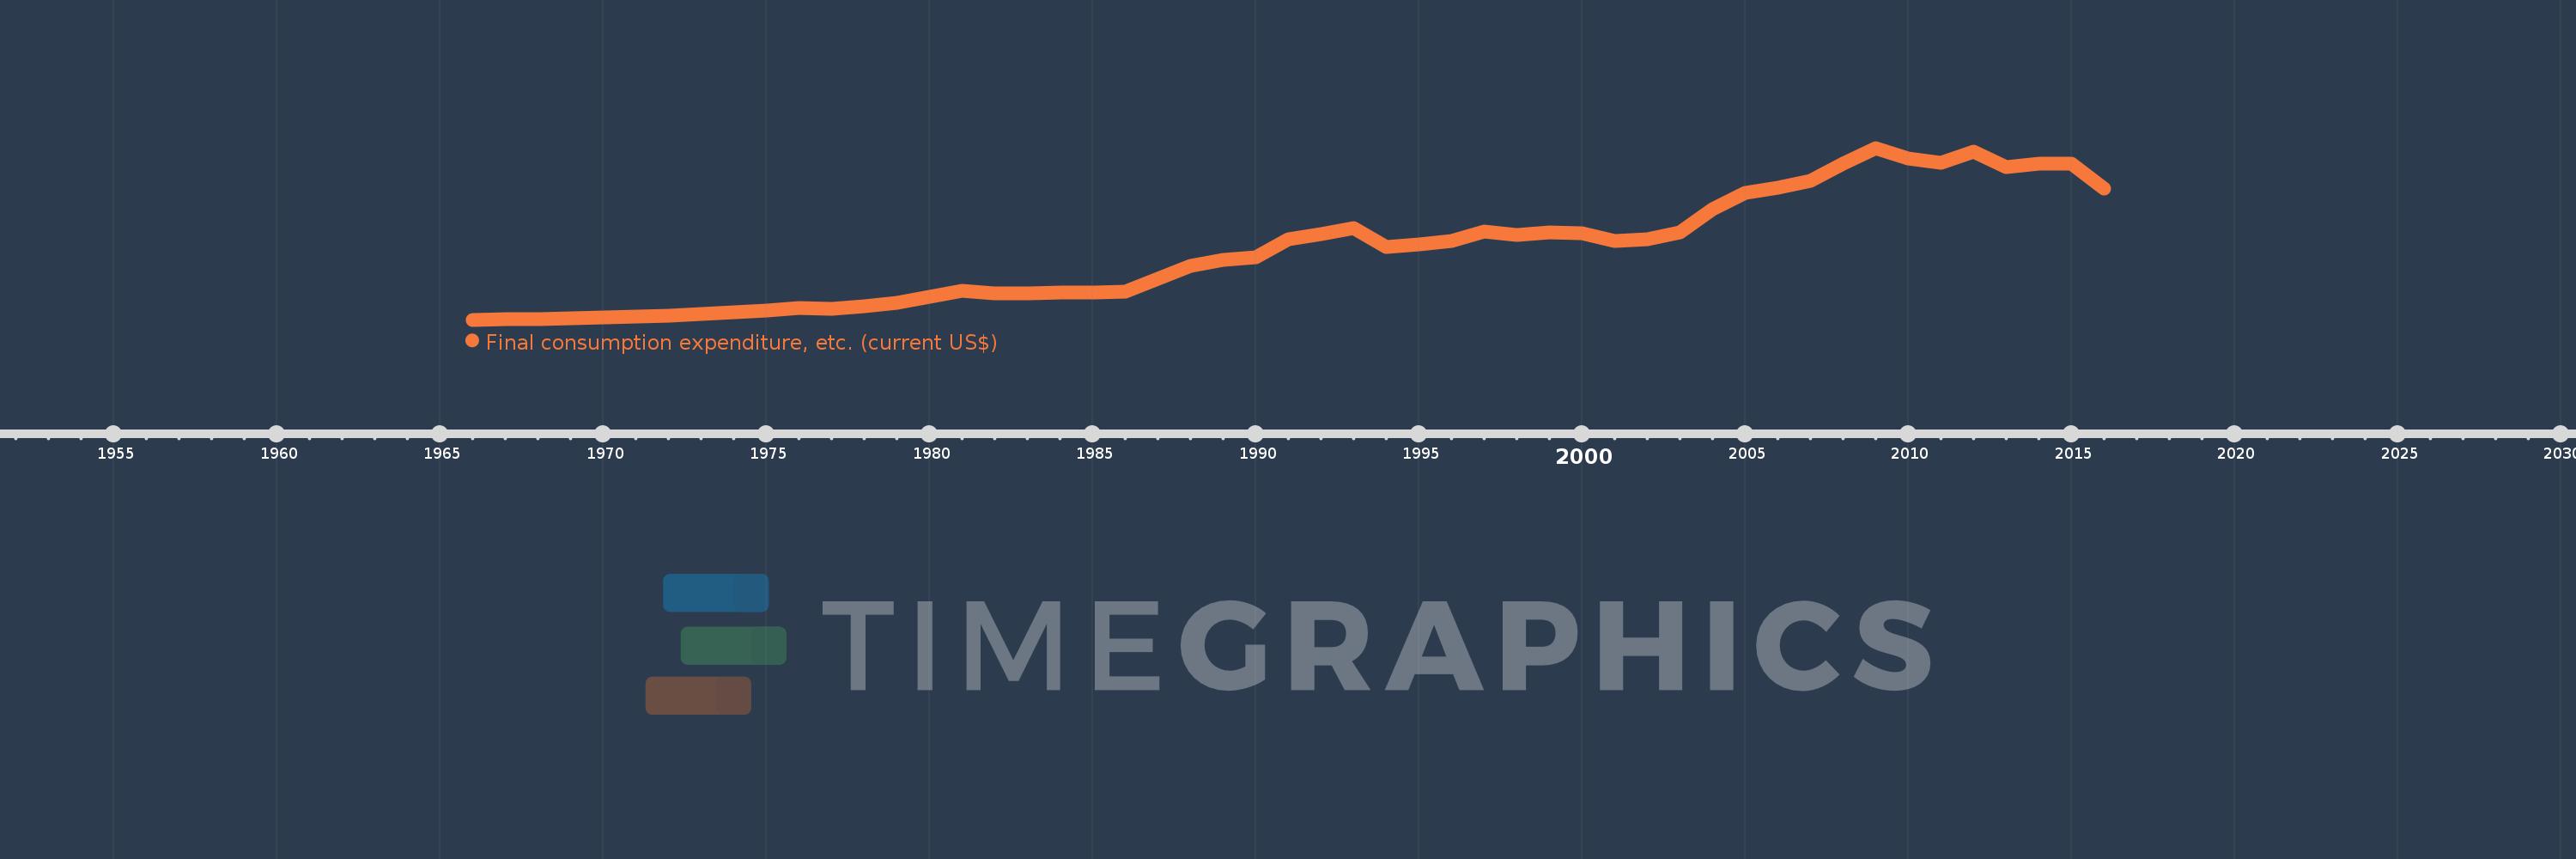
Final consumption expenditure, etc. (current US$)
2016,2015,2014,2013,2012,2011,2010,2009,2008,2007,2006,2005,2004,2003,2002,2001,2000,1999,1998,1997,1996,1995,1994,1993,1992,1991,1990,1989,1988,1987,1986,1985,1984,1983,1982,1981,1980,1979,1978,1977,1976,1975,1974,1973,1972,1971,1970,1969,1968,1967,1966
This statistics in other country:
AfghanistanAlbaniaAlgeriaAngolaAntigua and BarbudaArab WorldArgentinaArmeniaArubaAustraliaAustriaAzerbaijanBahamas, TheBahrainBangladeshBarbadosBelarusBelgiumBelizeBeninBermudaBhutanBoliviaBosnia and HerzegovinaBotswanaBrazilBrunei DarussalamBulgariaBurkina FasoBurundiCabo VerdeCambodiaCameroonCanadaCaribbean small statesCentral African RepublicCentral Europe and the BalticsChadChileChinaColombiaComorosCongo, Dem. Rep.Congo, Rep.Costa RicaCote d'IvoireCroatiaCubaCyprusCzech RepublicDenmarkDjiboutiDominicaDominican RepublicEarly-demographic dividendEast Asia & PacificEast Asia & Pacific (excluding high income)East Asia & Pacific (IDA & IBRD countries)EcuadorEgypt, Arab Rep.El SalvadorEquatorial GuineaEritreaEstoniaEthiopiaEuro areaEurope & Central AsiaEurope & Central Asia (excluding high income)Europe & Central Asia (IDA & IBRD countries)European UnionFaroe IslandsFijiFinlandFragile and conflict affected situationsFranceGabonGambia, TheGeorgiaGermanyGhanaGreeceGrenadaGuatemalaGuineaGuinea-BissauGuyanaHaitiHeavily indebted poor countries (HIPC)High incomeHondurasHong Kong SAR, ChinaHungaryIBRD onlyIcelandIDA & IBRD totalIDA blendIDA onlyIDA totalIndiaIndonesiaIran, Islamic Rep.IraqIrelandIsraelItalyJamaicaJapanJordanKazakhstanKenyaKiribatiKorea, Rep.KosovoKuwaitKyrgyz RepublicLao PDRLate-demographic dividendLatin America & Caribbean Latin America & Caribbean (excluding high income)Latin America & the Caribbean (IDA & IBRD countries)LatviaLeast developed countries: UN classificationLebanonLesothoLiberiaLibyaLithuaniaLow & middle incomeLow incomeLower middle incomeLuxembourgMacao SAR, ChinaMacedonia, FYRMadagascarMalawiMalaysiaMaldivesMaliMaltaMauritaniaMauritiusMexicoMicronesia, Fed. Sts.Middle East & North AfricaMiddle East & North Africa (excluding high income)Middle East & North Africa (IDA & IBRD countries)Middle incomeMoldovaMongoliaMontenegroMoroccoMozambiqueNamibiaNepalNetherlandsNew CaledoniaNew ZealandNicaraguaNigerNigeriaNorth AmericaNorwayOECD membersOmanOther small statesPakistanPanamaPapua New GuineaParaguayPeruPhilippinesPolandPortugalPost-demographic dividendPre-demographic dividendPuerto RicoQatarRomaniaRussian FederationRwandaSaudi ArabiaSenegalSerbiaSeychellesSierra LeoneSingaporeSlovak RepublicSloveniaSmall statesSolomon IslandsSouth AfricaSouth AsiaSouth Asia (IDA & IBRD)South SudanSpainSri LankaSt. Kitts and NevisSt. LuciaSt. Vincent and the GrenadinesSub-Saharan Africa Sub-Saharan Africa (excluding high income)Sub-Saharan Africa (IDA & IBRD countries)SudanSurinameSwazilandSwedenSwitzerlandSyrian Arab RepublicTajikistanTanzaniaThailandTimor-LesteTogoTongaTrinidad and TobagoTunisiaTurkeyTurkmenistanUgandaUkraineUnited Arab EmiratesUnited KingdomUnited StatesUpper middle incomeUruguayUzbekistanVanuatuVenezuela, RBVietnamWest Bank and GazaWorldYemen, Rep.ZambiaZimbabwe Timeline:
This timeline shows a graph from 1966 to 2016 of Italy. No data until 1965. Number of actual observations by date: 51.
Source name:
World Development Indicators
Source organization:
World Bank national accounts data, and OECD National Accounts data files.
Categories, topics:
Economy & Growth
Last updated:
apr 23, 2017
Indicators value changes by year
Minimum:
50.774 bln
jan 1, 1966
Maximum:
1.889 trl
jan 1, 2009
At the date of observation
Value
Absolute change
Change from previous value
jan 1, 1966
50.774 bln
+50.774 bln
0.0%
jan 1, 1967
55.746 bln
+4.972 bln
9.79%
jan 1, 1968
61.26 bln
+5.514 bln
9.89%
jan 1, 1969
64.978 bln
+3.718 bln
6.07%
jan 1, 1970
71.322 bln
+6.344 bln
9.76%
jan 1, 1971
83.704 bln
+12.382 bln
17.36%
jan 1, 1972
94.029 bln
+10.324 bln
12.33%
jan 1, 1973
110.784 bln
+16.755 bln
17.82%
jan 1, 1974
132.584 bln
+21.8 bln
19.68%
jan 1, 1975
147.854 bln
+15.27 bln
11.52%
jan 1, 1976
173.45 bln
+25.596 bln
17.31%
jan 1, 1977
167.557 bln
-5.893 bln
-3.4%
jan 1, 1978
192.259 bln
+24.701 bln
14.74%
jan 1, 1979
233.277 bln
+41.018 bln
21.33%
jan 1, 1980
293.469 bln
+60.192 bln
25.8%
jan 1, 1981
362.206 bln
+68.737 bln
23.42%
jan 1, 1982
332.882 bln
-29.324 bln
-8.1%
jan 1, 1983
331.352 bln
-1.531 bln
-0.46%
jan 1, 1984
342.342 bln
+10.99 bln
3.32%
jan 1, 1985
337.721 bln
-4.621 bln
-1.35%
jan 1, 1986
349.335 bln
+11.614 bln
3.44%
jan 1, 1987
493.069 bln
+143.734 bln
41.14%
jan 1, 1988
624.102 bln
+131.033 bln
26.58%
jan 1, 1989
689.893 bln
+65.791 bln
10.54%
jan 1, 1990
721.449 bln
+31.556 bln
4.57%
jan 1, 1991
912.424 bln
+190.975 bln
26.47%
jan 1, 1992
967.091 bln
+54.668 bln
5.99%
jan 1, 1993
1.035 trl
+67.556 bln
6.99%
jan 1, 1994
828.939 bln
-205.709 bln
-19.88%
jan 1, 1995
853.578 bln
+24.639 bln
2.97%
jan 1, 1996
895.802 bln
+42.223 bln
4.95%
jan 1, 1997
998.973 bln
+103.171 bln
11.52%
jan 1, 1998
954.218 bln
-44.755 bln
-4.48%
jan 1, 1999
981.08 bln
+26.862 bln
2.82%
jan 1, 2000
976.62 bln
-4.46 bln
-0.45%
jan 1, 2001
895.614 bln
-81.006 bln
-8.29%
jan 1, 2002
907.48 bln
+11.867 bln
1.32%
jan 1, 2003
985.819 bln
+78.339 bln
8.63%
jan 1, 2004
1.232 trl
+246.071 bln
24.96%
jan 1, 2005
1.407 trl
+175.235 bln
14.22%
jan 1, 2006
1.464 trl
+56.608 bln
4.02%
jan 1, 2007
1.534 trl
+69.829 bln
4.77%
jan 1, 2008
1.722 trl
+188.65 bln
12.3%
jan 1, 2009
1.889 trl
+166.646 bln
9.68%
jan 1, 2010
1.776 trl
-113.125 bln
-5.99%
jan 1, 2011
1.731 trl
-45.164 bln
-2.54%
jan 1, 2012
1.846 trl
+115.572 bln
6.68%
jan 1, 2013
1.682 trl
-164.034 bln
-8.89%
jan 1, 2014
1.721 trl
+39.038 bln
2.32%
jan 1, 2015
1.725 trl
+3.76 bln
0.22%
jan 1, 2016
1.456 trl
-268.978 bln
-15.59%
Ranking of countries by current statistics by years


Comments: