29
/
en
AIzaSyAYiBZKx7MnpbEhh9jyipgxe19OcubqV5w
April 1, 2024
108485
Comoros
COM
true
2
1
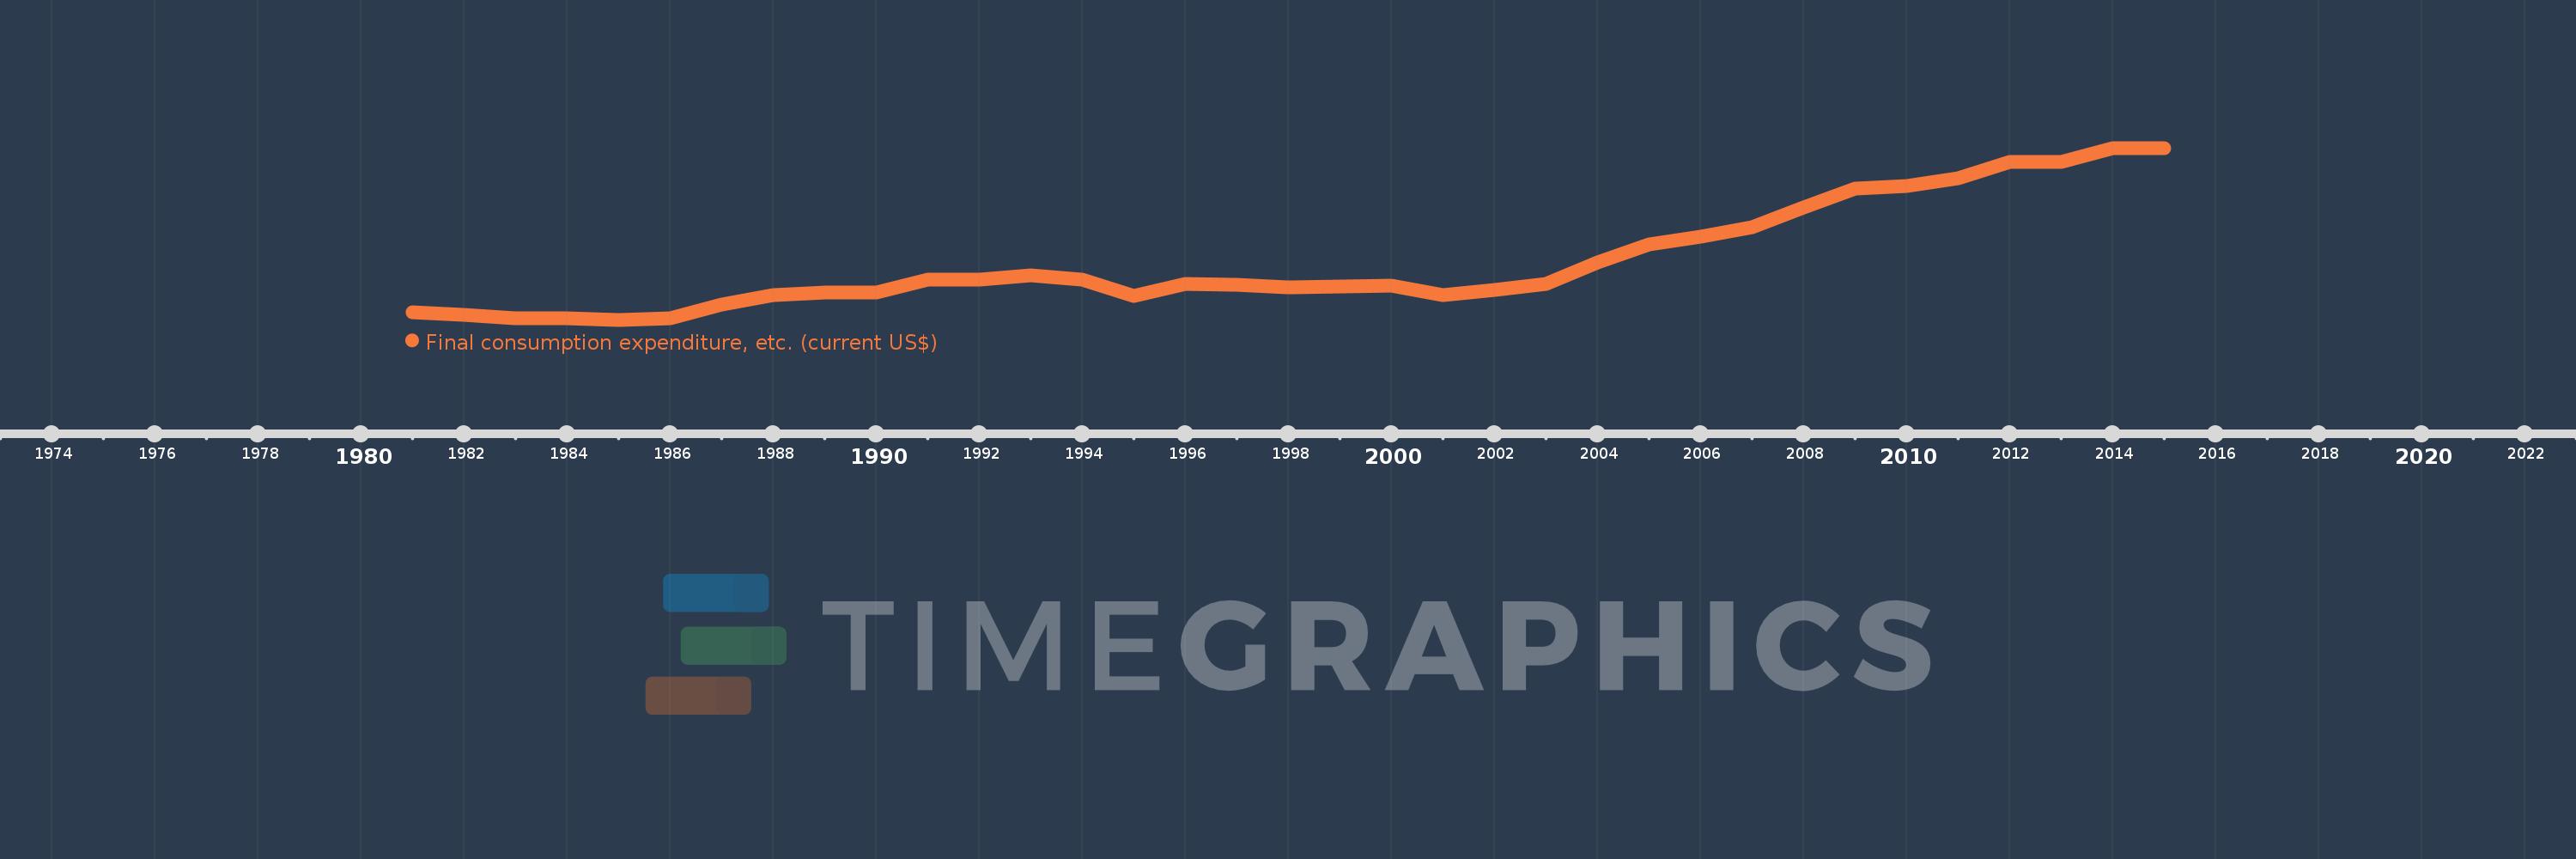
Final consumption expenditure, etc. (current US$)
2015,2014,2013,2012,2011,2010,2009,2008,2007,2006,2005,2004,2003,2002,2001,2000,1999,1998,1997,1996,1995,1994,1993,1992,1991,1990,1989,1988,1987,1986,1985,1984,1983,1982,1981
This statistics in other country:
AfghanistanAlbaniaAlgeriaAngolaAntigua and BarbudaArab WorldArgentinaArmeniaArubaAustraliaAustriaAzerbaijanBahamas, TheBahrainBangladeshBarbadosBelarusBelgiumBelizeBeninBermudaBhutanBoliviaBosnia and HerzegovinaBotswanaBrazilBrunei DarussalamBulgariaBurkina FasoBurundiCabo VerdeCambodiaCameroonCanadaCaribbean small statesCentral African RepublicCentral Europe and the BalticsChadChileChinaColombiaComorosCongo, Dem. Rep.Congo, Rep.Costa RicaCote d'IvoireCroatiaCubaCyprusCzech RepublicDenmarkDjiboutiDominicaDominican RepublicEarly-demographic dividendEast Asia & PacificEast Asia & Pacific (excluding high income)East Asia & Pacific (IDA & IBRD countries)EcuadorEgypt, Arab Rep.El SalvadorEquatorial GuineaEritreaEstoniaEthiopiaEuro areaEurope & Central AsiaEurope & Central Asia (excluding high income)Europe & Central Asia (IDA & IBRD countries)European UnionFaroe IslandsFijiFinlandFragile and conflict affected situationsFranceGabonGambia, TheGeorgiaGermanyGhanaGreeceGrenadaGuatemalaGuineaGuinea-BissauGuyanaHaitiHeavily indebted poor countries (HIPC)High incomeHondurasHong Kong SAR, ChinaHungaryIBRD onlyIcelandIDA & IBRD totalIDA blendIDA onlyIDA totalIndiaIndonesiaIran, Islamic Rep.IraqIrelandIsraelItalyJamaicaJapanJordanKazakhstanKenyaKiribatiKorea, Rep.KosovoKuwaitKyrgyz RepublicLao PDRLate-demographic dividendLatin America & Caribbean Latin America & Caribbean (excluding high income)Latin America & the Caribbean (IDA & IBRD countries)LatviaLeast developed countries: UN classificationLebanonLesothoLiberiaLibyaLithuaniaLow & middle incomeLow incomeLower middle incomeLuxembourgMacao SAR, ChinaMacedonia, FYRMadagascarMalawiMalaysiaMaldivesMaliMaltaMauritaniaMauritiusMexicoMicronesia, Fed. Sts.Middle East & North AfricaMiddle East & North Africa (excluding high income)Middle East & North Africa (IDA & IBRD countries)Middle incomeMoldovaMongoliaMontenegroMoroccoMozambiqueNamibiaNepalNetherlandsNew CaledoniaNew ZealandNicaraguaNigerNigeriaNorth AmericaNorwayOECD membersOmanOther small statesPakistanPanamaPapua New GuineaParaguayPeruPhilippinesPolandPortugalPost-demographic dividendPre-demographic dividendPuerto RicoQatarRomaniaRussian FederationRwandaSaudi ArabiaSenegalSerbiaSeychellesSierra LeoneSingaporeSlovak RepublicSloveniaSmall statesSolomon IslandsSouth AfricaSouth AsiaSouth Asia (IDA & IBRD)South SudanSpainSri LankaSt. Kitts and NevisSt. LuciaSt. Vincent and the GrenadinesSub-Saharan Africa Sub-Saharan Africa (excluding high income)Sub-Saharan Africa (IDA & IBRD countries)SudanSurinameSwazilandSwedenSwitzerlandSyrian Arab RepublicTajikistanTanzaniaThailandTimor-LesteTogoTongaTrinidad and TobagoTunisiaTurkeyTurkmenistanUgandaUkraineUnited Arab EmiratesUnited KingdomUnited StatesUpper middle incomeUruguayUzbekistanVanuatuVenezuela, RBVietnamWest Bank and GazaWorldYemen, Rep.ZambiaZimbabwe Timeline:
This timeline shows a graph from 1981 to 2015 of Comoros. No data until 1980. Number of actual observations by date: 35.
Source name:
World Development Indicators
Source organization:
World Bank national accounts data, and OECD National Accounts data files.
Categories, topics:
Economy & Growth
Last updated:
apr 23, 2017
Indicators value changes by year
Minimum:
109.163 mln
jan 1, 1985
Maximum:
753.307 mln
jan 1, 2014
At the date of observation
Value
Absolute change
Change from previous value
jan 1, 1981
135.949 mln
+135.949 mln
0.0%
jan 1, 1982
126.232 mln
-9.717 mln
-7.15%
jan 1, 1983
114.338 mln
-11.894 mln
-9.42%
jan 1, 1984
115.524 mln
+1.186 mln
1.04%
jan 1, 1985
109.163 mln
-6.361 mln
-5.51%
jan 1, 1986
114.798 mln
+5.635 mln
5.16%
jan 1, 1987
164.867 mln
+50.069 mln
43.62%
jan 1, 1988
200.38 mln
+35.513 mln
21.54%
jan 1, 1989
211.526 mln
+11.146 mln
5.56%
jan 1, 1990
212.667 mln
+1.141 mln
0.54%
jan 1, 1991
258.1 mln
+45.433 mln
21.36%
jan 1, 1992
259.053 mln
+952.761K
0.37%
jan 1, 1993
274.941 mln
+15.888 mln
6.13%
jan 1, 1994
259.45 mln
-15.491 mln
-5.63%
jan 1, 1995
197.82 mln
-61.63 mln
-23.75%
jan 1, 1996
244.293 mln
+46.474 mln
23.49%
jan 1, 1997
238.878 mln
-5.415 mln
-2.22%
jan 1, 1998
231.259 mln
-7.619 mln
-3.19%
jan 1, 1999
232.514 mln
+1.255 mln
0.54%
jan 1, 2000
236.475 mln
+3.96 mln
1.7%
jan 1, 2001
201.53 mln
-34.945 mln
-14.78%
jan 1, 2002
221.988 mln
+20.458 mln
10.15%
jan 1, 2003
242.434 mln
+20.446 mln
9.21%
jan 1, 2004
323.411 mln
+80.977 mln
33.4%
jan 1, 2005
392.408 mln
+68.997 mln
21.33%
jan 1, 2006
421.475 mln
+29.067 mln
7.41%
jan 1, 2007
455.902 mln
+34.427 mln
8.17%
jan 1, 2008
531.139 mln
+75.237 mln
16.5%
jan 1, 2009
600.922 mln
+69.783 mln
13.14%
jan 1, 2010
611.948 mln
+11.026 mln
1.83%
jan 1, 2011
638.977 mln
+27.028 mln
4.42%
jan 1, 2012
699.415 mln
+60.439 mln
9.46%
jan 1, 2013
701.932 mln
+2.516 mln
0.36%
jan 1, 2014
753.307 mln
+51.376 mln
7.32%
jan 1, 2015
751.782 mln
-1.525 mln
-0.2%
Ranking of countries by current statistics by years


Comments: