29
/
en
AIzaSyAYiBZKx7MnpbEhh9jyipgxe19OcubqV5w
April 1, 2024
102401
Central African Republic
CAF
true
2
1
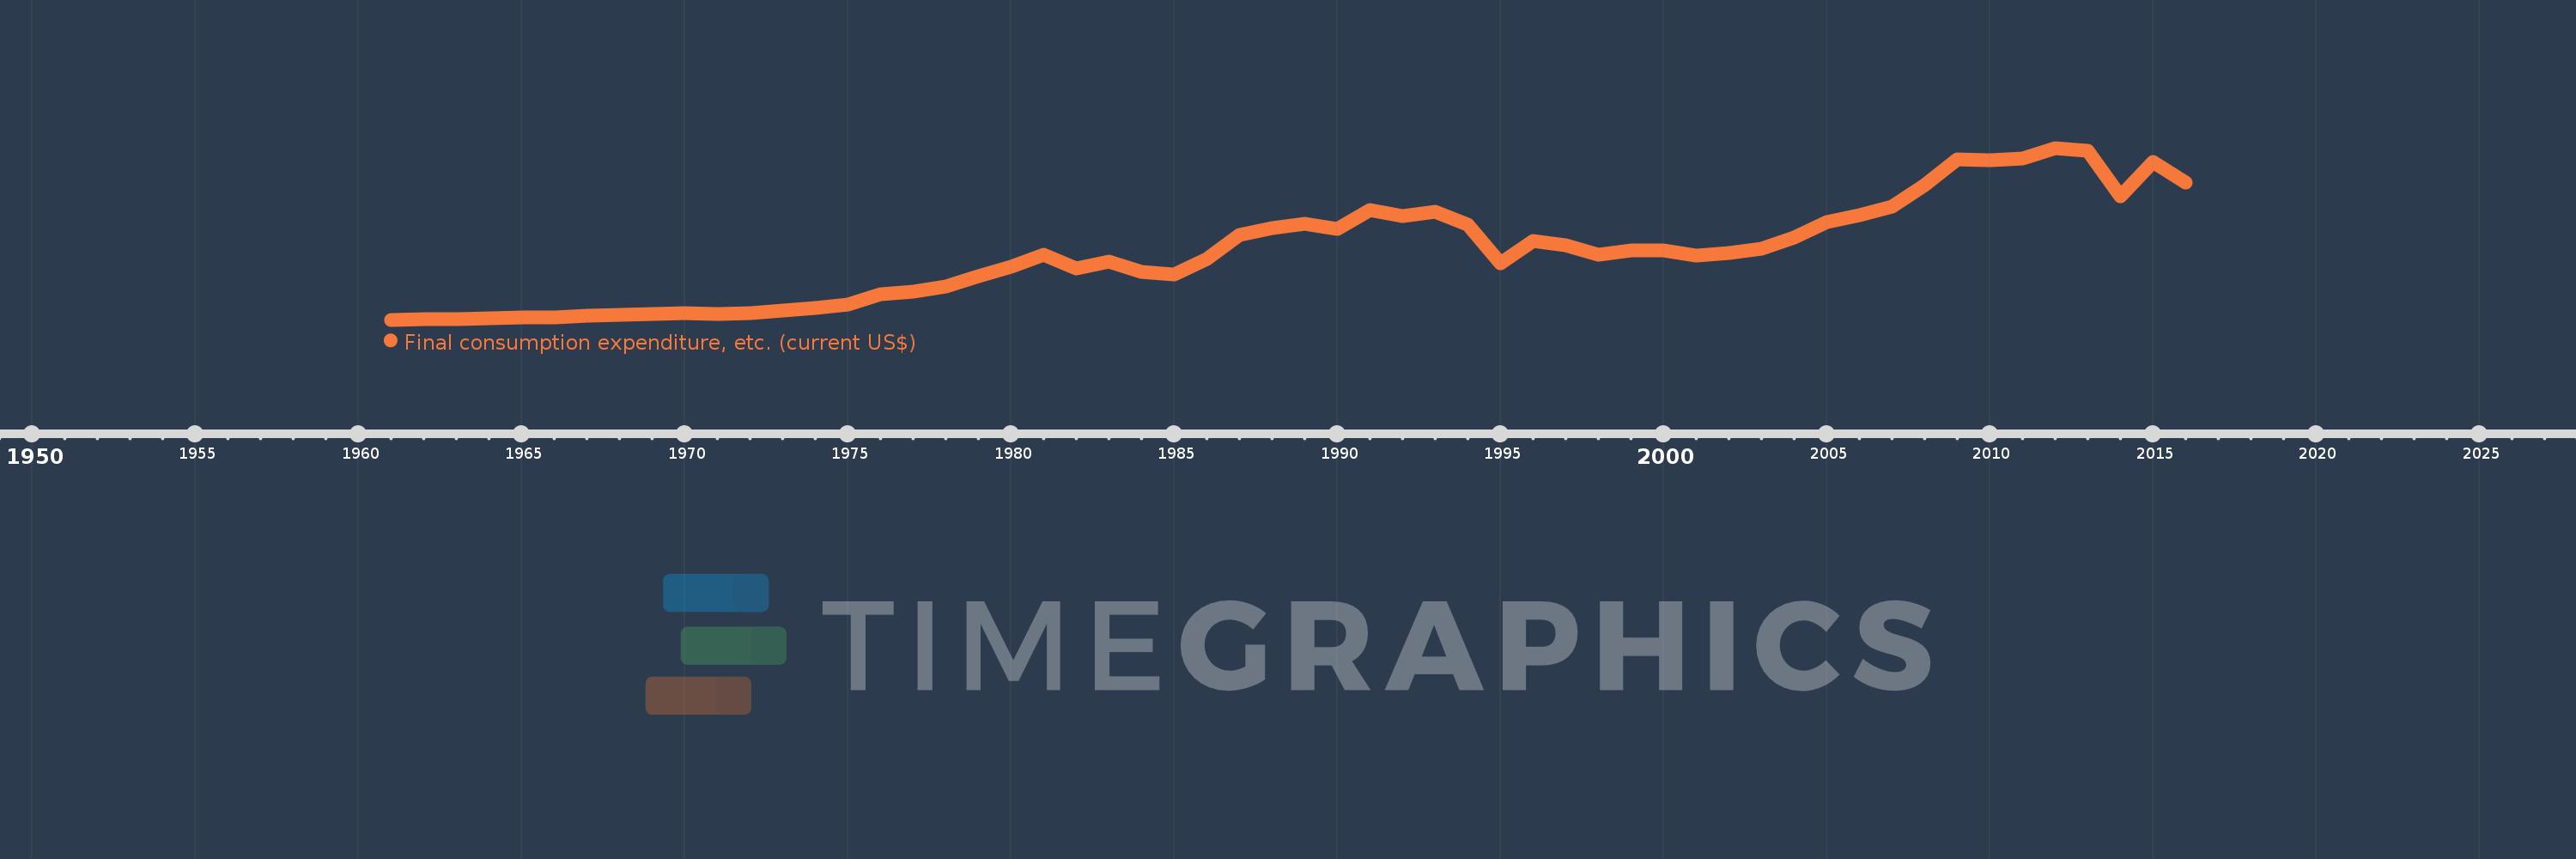
Final consumption expenditure, etc. (current US$)
2016,2015,2014,2013,2012,2011,2010,2009,2008,2007,2006,2005,2004,2003,2002,2001,2000,1999,1998,1997,1996,1995,1994,1993,1992,1991,1990,1989,1988,1987,1986,1985,1984,1983,1982,1981,1980,1979,1978,1977,1976,1975,1974,1973,1972,1971,1970,1969,1968,1967,1966,1965,1964,1963,1962,1961
This statistics in other country:
AfghanistanAlbaniaAlgeriaAngolaAntigua and BarbudaArab WorldArgentinaArmeniaArubaAustraliaAustriaAzerbaijanBahamas, TheBahrainBangladeshBarbadosBelarusBelgiumBelizeBeninBermudaBhutanBoliviaBosnia and HerzegovinaBotswanaBrazilBrunei DarussalamBulgariaBurkina FasoBurundiCabo VerdeCambodiaCameroonCanadaCaribbean small statesCentral African RepublicCentral Europe and the BalticsChadChileChinaColombiaComorosCongo, Dem. Rep.Congo, Rep.Costa RicaCote d'IvoireCroatiaCubaCyprusCzech RepublicDenmarkDjiboutiDominicaDominican RepublicEarly-demographic dividendEast Asia & PacificEast Asia & Pacific (excluding high income)East Asia & Pacific (IDA & IBRD countries)EcuadorEgypt, Arab Rep.El SalvadorEquatorial GuineaEritreaEstoniaEthiopiaEuro areaEurope & Central AsiaEurope & Central Asia (excluding high income)Europe & Central Asia (IDA & IBRD countries)European UnionFaroe IslandsFijiFinlandFragile and conflict affected situationsFranceGabonGambia, TheGeorgiaGermanyGhanaGreeceGrenadaGuatemalaGuineaGuinea-BissauGuyanaHaitiHeavily indebted poor countries (HIPC)High incomeHondurasHong Kong SAR, ChinaHungaryIBRD onlyIcelandIDA & IBRD totalIDA blendIDA onlyIDA totalIndiaIndonesiaIran, Islamic Rep.IraqIrelandIsraelItalyJamaicaJapanJordanKazakhstanKenyaKiribatiKorea, Rep.KosovoKuwaitKyrgyz RepublicLao PDRLate-demographic dividendLatin America & Caribbean Latin America & Caribbean (excluding high income)Latin America & the Caribbean (IDA & IBRD countries)LatviaLeast developed countries: UN classificationLebanonLesothoLiberiaLibyaLithuaniaLow & middle incomeLow incomeLower middle incomeLuxembourgMacao SAR, ChinaMacedonia, FYRMadagascarMalawiMalaysiaMaldivesMaliMaltaMauritaniaMauritiusMexicoMicronesia, Fed. Sts.Middle East & North AfricaMiddle East & North Africa (excluding high income)Middle East & North Africa (IDA & IBRD countries)Middle incomeMoldovaMongoliaMontenegroMoroccoMozambiqueNamibiaNepalNetherlandsNew CaledoniaNew ZealandNicaraguaNigerNigeriaNorth AmericaNorwayOECD membersOmanOther small statesPakistanPanamaPapua New GuineaParaguayPeruPhilippinesPolandPortugalPost-demographic dividendPre-demographic dividendPuerto RicoQatarRomaniaRussian FederationRwandaSaudi ArabiaSenegalSerbiaSeychellesSierra LeoneSingaporeSlovak RepublicSloveniaSmall statesSolomon IslandsSouth AfricaSouth AsiaSouth Asia (IDA & IBRD)South SudanSpainSri LankaSt. Kitts and NevisSt. LuciaSt. Vincent and the GrenadinesSub-Saharan Africa Sub-Saharan Africa (excluding high income)Sub-Saharan Africa (IDA & IBRD countries)SudanSurinameSwazilandSwedenSwitzerlandSyrian Arab RepublicTajikistanTanzaniaThailandTimor-LesteTogoTongaTrinidad and TobagoTunisiaTurkeyTurkmenistanUgandaUkraineUnited Arab EmiratesUnited KingdomUnited StatesUpper middle incomeUruguayUzbekistanVanuatuVenezuela, RBVietnamWest Bank and GazaWorldYemen, Rep.ZambiaZimbabwe Timeline:
This timeline shows a graph from 1961 to 2016 of Central African Republic. No data until 1960. Number of actual observations by date: 56.
Source name:
World Development Indicators
Source organization:
World Bank national accounts data, and OECD National Accounts data files.
Categories, topics:
Economy & Growth
Last updated:
apr 23, 2017
Indicators value changes by year
Minimum:
102.367 mln
jan 1, 1961
Maximum:
2.115 bln
jan 1, 2012
At the date of observation
Value
Absolute change
Change from previous value
jan 1, 1961
102.367 mln
+102.367 mln
0.0%
jan 1, 1962
108.456 mln
+6.089 mln
5.95%
jan 1, 1963
111.83 mln
+3.374 mln
3.11%
jan 1, 1964
118.359 mln
+6.529 mln
5.84%
jan 1, 1965
128.149 mln
+9.79 mln
8.27%
jan 1, 1966
134.252 mln
+6.103 mln
4.76%
jan 1, 1967
146.94 mln
+12.688 mln
9.45%
jan 1, 1968
161.788 mln
+14.848 mln
10.1%
jan 1, 1969
170.864 mln
+9.076 mln
5.61%
jan 1, 1970
176.565 mln
+5.701 mln
3.34%
jan 1, 1971
173.298 mln
-3.268 mln
-1.85%
jan 1, 1972
179.041 mln
+5.743 mln
3.31%
jan 1, 1973
208.311 mln
+29.27 mln
16.35%
jan 1, 1974
235.992 mln
+27.681 mln
13.29%
jan 1, 1975
281.673 mln
+45.681 mln
19.36%
jan 1, 1976
397.549 mln
+115.876 mln
41.14%
jan 1, 1977
429.378 mln
+31.829 mln
8.01%
jan 1, 1978
494.953 mln
+65.576 mln
15.27%
jan 1, 1979
608.005 mln
+113.052 mln
22.84%
jan 1, 1980
721.13 mln
+113.125 mln
18.61%
jan 1, 1981
867.604 mln
+146.473 mln
20.31%
jan 1, 1982
701.313 mln
-166.291 mln
-19.17%
jan 1, 1983
788.552 mln
+87.239 mln
12.44%
jan 1, 1984
662.859 mln
-125.692 mln
-15.94%
jan 1, 1985
636.548 mln
-26.311 mln
-3.97%
jan 1, 1986
815.064 mln
+178.515 mln
28.04%
jan 1, 1987
1.096 bln
+280.904 mln
34.46%
jan 1, 1988
1.178 bln
+81.906 mln
7.47%
jan 1, 1989
1.224 bln
+46.546 mln
3.95%
jan 1, 1990
1.165 bln
-59.547 mln
-4.86%
jan 1, 1991
1.385 bln
+219.651 mln
18.86%
jan 1, 1992
1.321 bln
-63.787 mln
-4.61%
jan 1, 1993
1.371 bln
+50.167 mln
3.8%
jan 1, 1994
1.218 bln
-153.363 mln
-11.19%
jan 1, 1995
765.318 mln
-452.223 mln
-37.14%
jan 1, 1996
1.025 bln
+259.892 mln
33.96%
jan 1, 1997
976.233 mln
-48.977 mln
-4.78%
jan 1, 1998
862.439 mln
-113.795 mln
-11.66%
jan 1, 1999
916.292 mln
+53.853 mln
6.24%
jan 1, 2000
917.551 mln
+1.259 mln
0.14%
jan 1, 2001
858.195 mln
-59.356 mln
-6.47%
jan 1, 2002
886.874 mln
+28.679 mln
3.34%
jan 1, 2003
937.439 mln
+50.565 mln
5.7%
jan 1, 2004
1.064 bln
+126.573 mln
13.5%
jan 1, 2005
1.25 bln
+186.204 mln
17.5%
jan 1, 2006
1.33 bln
+79.765 mln
6.38%
jan 1, 2007
1.424 bln
+94.5 mln
7.11%
jan 1, 2008
1.675 bln
+250.948 mln
17.62%
jan 1, 2009
1.979 bln
+304.021 mln
18.15%
jan 1, 2010
1.97 bln
-9.891 mln
-0.5%
jan 1, 2011
1.995 bln
+25.131 mln
1.28%
jan 1, 2012
2.115 bln
+120.006 mln
6.02%
jan 1, 2013
2.084 bln
-30.904 mln
-1.46%
jan 1, 2014
1.547 bln
-536.951 mln
-25.77%
jan 1, 2015
1.947 bln
+400.13 mln
25.87%
jan 1, 2016
1.711 bln
-235.793 mln
-12.11%
Ranking of countries by current statistics by years


Comments: