29
/
en
AIzaSyAYiBZKx7MnpbEhh9jyipgxe19OcubqV5w
April 1, 2024
223526
Philippines
PHL
true
2
1
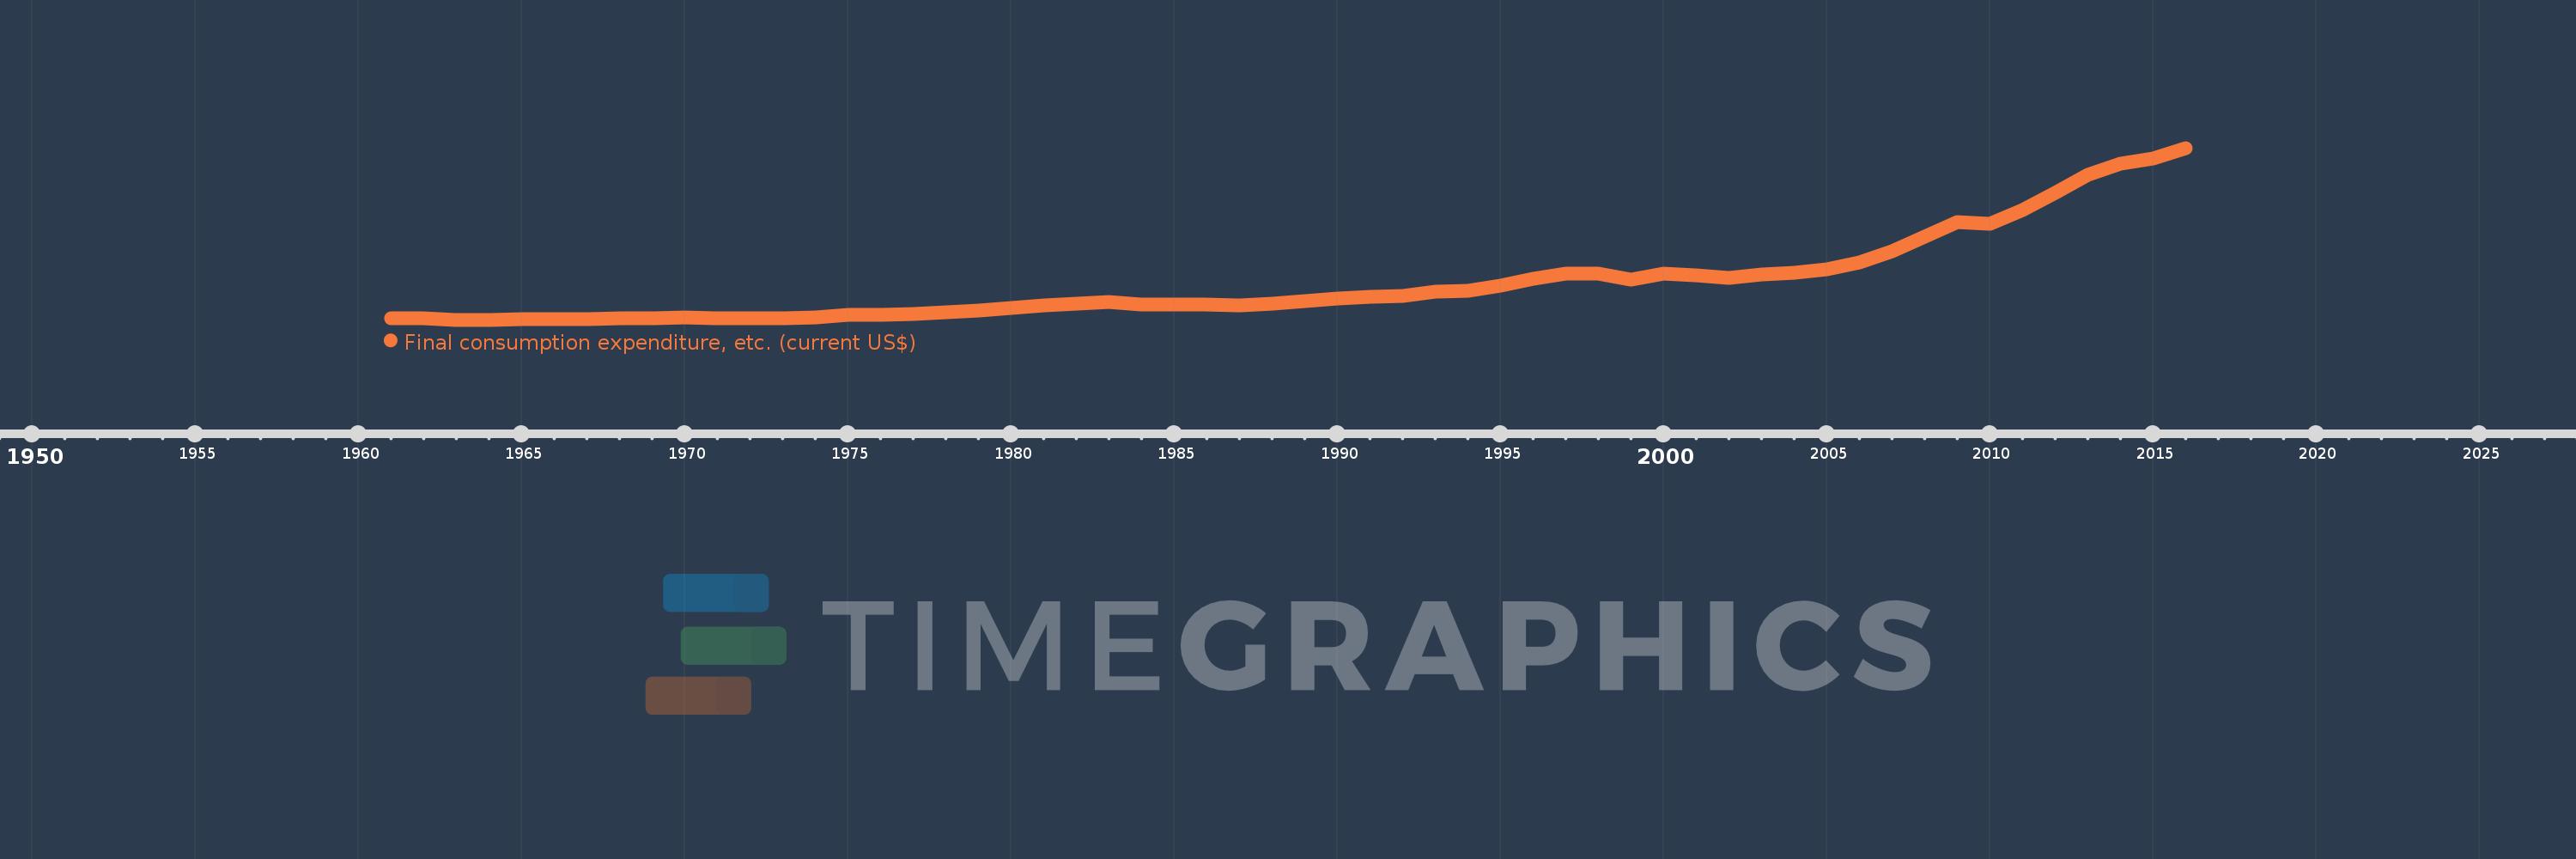
Final consumption expenditure, etc. (current US$)
2016,2015,2014,2013,2012,2011,2010,2009,2008,2007,2006,2005,2004,2003,2002,2001,2000,1999,1998,1997,1996,1995,1994,1993,1992,1991,1990,1989,1988,1987,1986,1985,1984,1983,1982,1981,1980,1979,1978,1977,1976,1975,1974,1973,1972,1971,1970,1969,1968,1967,1966,1965,1964,1963,1962,1961
This statistics in other country:
AfghanistanAlbaniaAlgeriaAngolaAntigua and BarbudaArab WorldArgentinaArmeniaArubaAustraliaAustriaAzerbaijanBahamas, TheBahrainBangladeshBarbadosBelarusBelgiumBelizeBeninBermudaBhutanBoliviaBosnia and HerzegovinaBotswanaBrazilBrunei DarussalamBulgariaBurkina FasoBurundiCabo VerdeCambodiaCameroonCanadaCaribbean small statesCentral African RepublicCentral Europe and the BalticsChadChileChinaColombiaComorosCongo, Dem. Rep.Congo, Rep.Costa RicaCote d'IvoireCroatiaCubaCyprusCzech RepublicDenmarkDjiboutiDominicaDominican RepublicEarly-demographic dividendEast Asia & PacificEast Asia & Pacific (excluding high income)East Asia & Pacific (IDA & IBRD countries)EcuadorEgypt, Arab Rep.El SalvadorEquatorial GuineaEritreaEstoniaEthiopiaEuro areaEurope & Central AsiaEurope & Central Asia (excluding high income)Europe & Central Asia (IDA & IBRD countries)European UnionFaroe IslandsFijiFinlandFragile and conflict affected situationsFranceGabonGambia, TheGeorgiaGermanyGhanaGreeceGrenadaGuatemalaGuineaGuinea-BissauGuyanaHaitiHeavily indebted poor countries (HIPC)High incomeHondurasHong Kong SAR, ChinaHungaryIBRD onlyIcelandIDA & IBRD totalIDA blendIDA onlyIDA totalIndiaIndonesiaIran, Islamic Rep.IraqIrelandIsraelItalyJamaicaJapanJordanKazakhstanKenyaKiribatiKorea, Rep.KosovoKuwaitKyrgyz RepublicLao PDRLate-demographic dividendLatin America & Caribbean Latin America & Caribbean (excluding high income)Latin America & the Caribbean (IDA & IBRD countries)LatviaLeast developed countries: UN classificationLebanonLesothoLiberiaLibyaLithuaniaLow & middle incomeLow incomeLower middle incomeLuxembourgMacao SAR, ChinaMacedonia, FYRMadagascarMalawiMalaysiaMaldivesMaliMaltaMauritaniaMauritiusMexicoMicronesia, Fed. Sts.Middle East & North AfricaMiddle East & North Africa (excluding high income)Middle East & North Africa (IDA & IBRD countries)Middle incomeMoldovaMongoliaMontenegroMoroccoMozambiqueNamibiaNepalNetherlandsNew CaledoniaNew ZealandNicaraguaNigerNigeriaNorth AmericaNorwayOECD membersOmanOther small statesPakistanPanamaPapua New GuineaParaguayPeruPhilippinesPolandPortugalPost-demographic dividendPre-demographic dividendPuerto RicoQatarRomaniaRussian FederationRwandaSaudi ArabiaSenegalSerbiaSeychellesSierra LeoneSingaporeSlovak RepublicSloveniaSmall statesSolomon IslandsSouth AfricaSouth AsiaSouth Asia (IDA & IBRD)South SudanSpainSri LankaSt. Kitts and NevisSt. LuciaSt. Vincent and the GrenadinesSub-Saharan Africa Sub-Saharan Africa (excluding high income)Sub-Saharan Africa (IDA & IBRD countries)SudanSurinameSwazilandSwedenSwitzerlandSyrian Arab RepublicTajikistanTanzaniaThailandTimor-LesteTogoTongaTrinidad and TobagoTunisiaTurkeyTurkmenistanUgandaUkraineUnited Arab EmiratesUnited KingdomUnited StatesUpper middle incomeUruguayUzbekistanVanuatuVenezuela, RBVietnamWest Bank and GazaWorldYemen, Rep.ZambiaZimbabwe Timeline:
This timeline shows a graph from 1961 to 2016 of Philippines. No data until 1960. Number of actual observations by date: 56.
Source name:
World Development Indicators
Source organization:
World Bank national accounts data, and OECD National Accounts data files.
Categories, topics:
Economy & Growth
Last updated:
apr 23, 2017
Indicators value changes by year
Minimum:
3.614 bln
jan 1, 1963
Maximum:
251.815 bln
jan 1, 2016
At the date of observation
Value
Absolute change
Change from previous value
jan 1, 1961
5.446 bln
+5.446 bln
0.0%
jan 1, 1962
5.885 bln
+439.657 mln
8.07%
jan 1, 1963
3.614 bln
-2.271 bln
-38.59%
jan 1, 1964
3.721 bln
+106.969 mln
2.96%
jan 1, 1965
4.034 bln
+313.213 mln
8.42%
jan 1, 1966
4.404 bln
+369.974 mln
9.17%
jan 1, 1967
4.819 bln
+415.352 mln
9.43%
jan 1, 1968
5.25 bln
+430.703 mln
8.94%
jan 1, 1969
6.074 bln
+823.39 mln
15.68%
jan 1, 1970
6.783 bln
+709.098 mln
11.68%
jan 1, 1971
5.224 bln
-1.558 bln
-22.97%
jan 1, 1972
5.848 bln
+623.852 mln
11.94%
jan 1, 1973
6.337 bln
+488.599 mln
8.35%
jan 1, 1974
7.392 bln
+1.055 bln
16.65%
jan 1, 1975
10.389 bln
+2.997 bln
40.55%
jan 1, 1976
11.206 bln
+817.077 mln
7.86%
jan 1, 1977
12.492 bln
+1.286 bln
11.48%
jan 1, 1978
14.233 bln
+1.741 bln
13.94%
jan 1, 1979
16.687 bln
+2.454 bln
17.24%
jan 1, 1980
20.419 bln
+3.732 bln
22.37%
jan 1, 1981
24.601 bln
+4.182 bln
20.48%
jan 1, 1982
27.047 bln
+2.445 bln
9.94%
jan 1, 1983
28.942 bln
+1.895 bln
7.01%
jan 1, 1984
25.622 bln
-3.32 bln
-11.47%
jan 1, 1985
25.347 bln
-274.913 mln
-1.07%
jan 1, 1986
25.673 bln
+325.597 mln
1.28%
jan 1, 1987
24.136 bln
-1.536 bln
-5.98%
jan 1, 1988
27.247 bln
+3.111 bln
12.89%
jan 1, 1989
30.262 bln
+3.015 bln
11.06%
jan 1, 1990
34.297 bln
+4.035 bln
13.33%
jan 1, 1991
36.166 bln
+1.869 bln
5.45%
jan 1, 1992
37.593 bln
+1.427 bln
3.95%
jan 1, 1993
44.267 bln
+6.674 bln
17.75%
jan 1, 1994
45.922 bln
+1.655 bln
3.74%
jan 1, 1995
52.706 bln
+6.784 bln
14.77%
jan 1, 1996
63.279 bln
+10.572 bln
20.06%
jan 1, 1997
70.231 bln
+6.952 bln
10.99%
jan 1, 1998
70.455 bln
+224.017 mln
0.32%
jan 1, 1999
61.916 bln
-8.539 bln
-12.12%
jan 1, 2000
70.523 bln
+8.607 bln
13.9%
jan 1, 2001
67.757 bln
-2.766 bln
-3.92%
jan 1, 2002
64.605 bln
-3.153 bln
-4.65%
jan 1, 2003
68.723 bln
+4.119 bln
6.38%
jan 1, 2004
70.948 bln
+2.225 bln
3.24%
jan 1, 2005
76.647 bln
+5.699 bln
8.03%
jan 1, 2006
86.636 bln
+9.989 bln
13.03%
jan 1, 2007
102.383 bln
+15.747 bln
18.18%
jan 1, 2008
123.611 bln
+21.228 bln
20.73%
jan 1, 2009
144.878 bln
+21.267 bln
17.21%
jan 1, 2010
142.3 bln
-2.578 bln
-1.78%
jan 1, 2011
162.212 bln
+19.912 bln
13.99%
jan 1, 2012
186.42 bln
+24.208 bln
14.92%
jan 1, 2013
212.723 bln
+26.303 bln
14.11%
jan 1, 2014
228.869 bln
+16.147 bln
7.59%
jan 1, 2015
236.547 bln
+7.678 bln
3.35%
jan 1, 2016
251.815 bln
+15.268 bln
6.45%
Ranking of countries by current statistics by years


Comments: