29
/
en
AIzaSyAYiBZKx7MnpbEhh9jyipgxe19OcubqV5w
April 1, 2024
123456
Ecuador
ECU
true
2
1
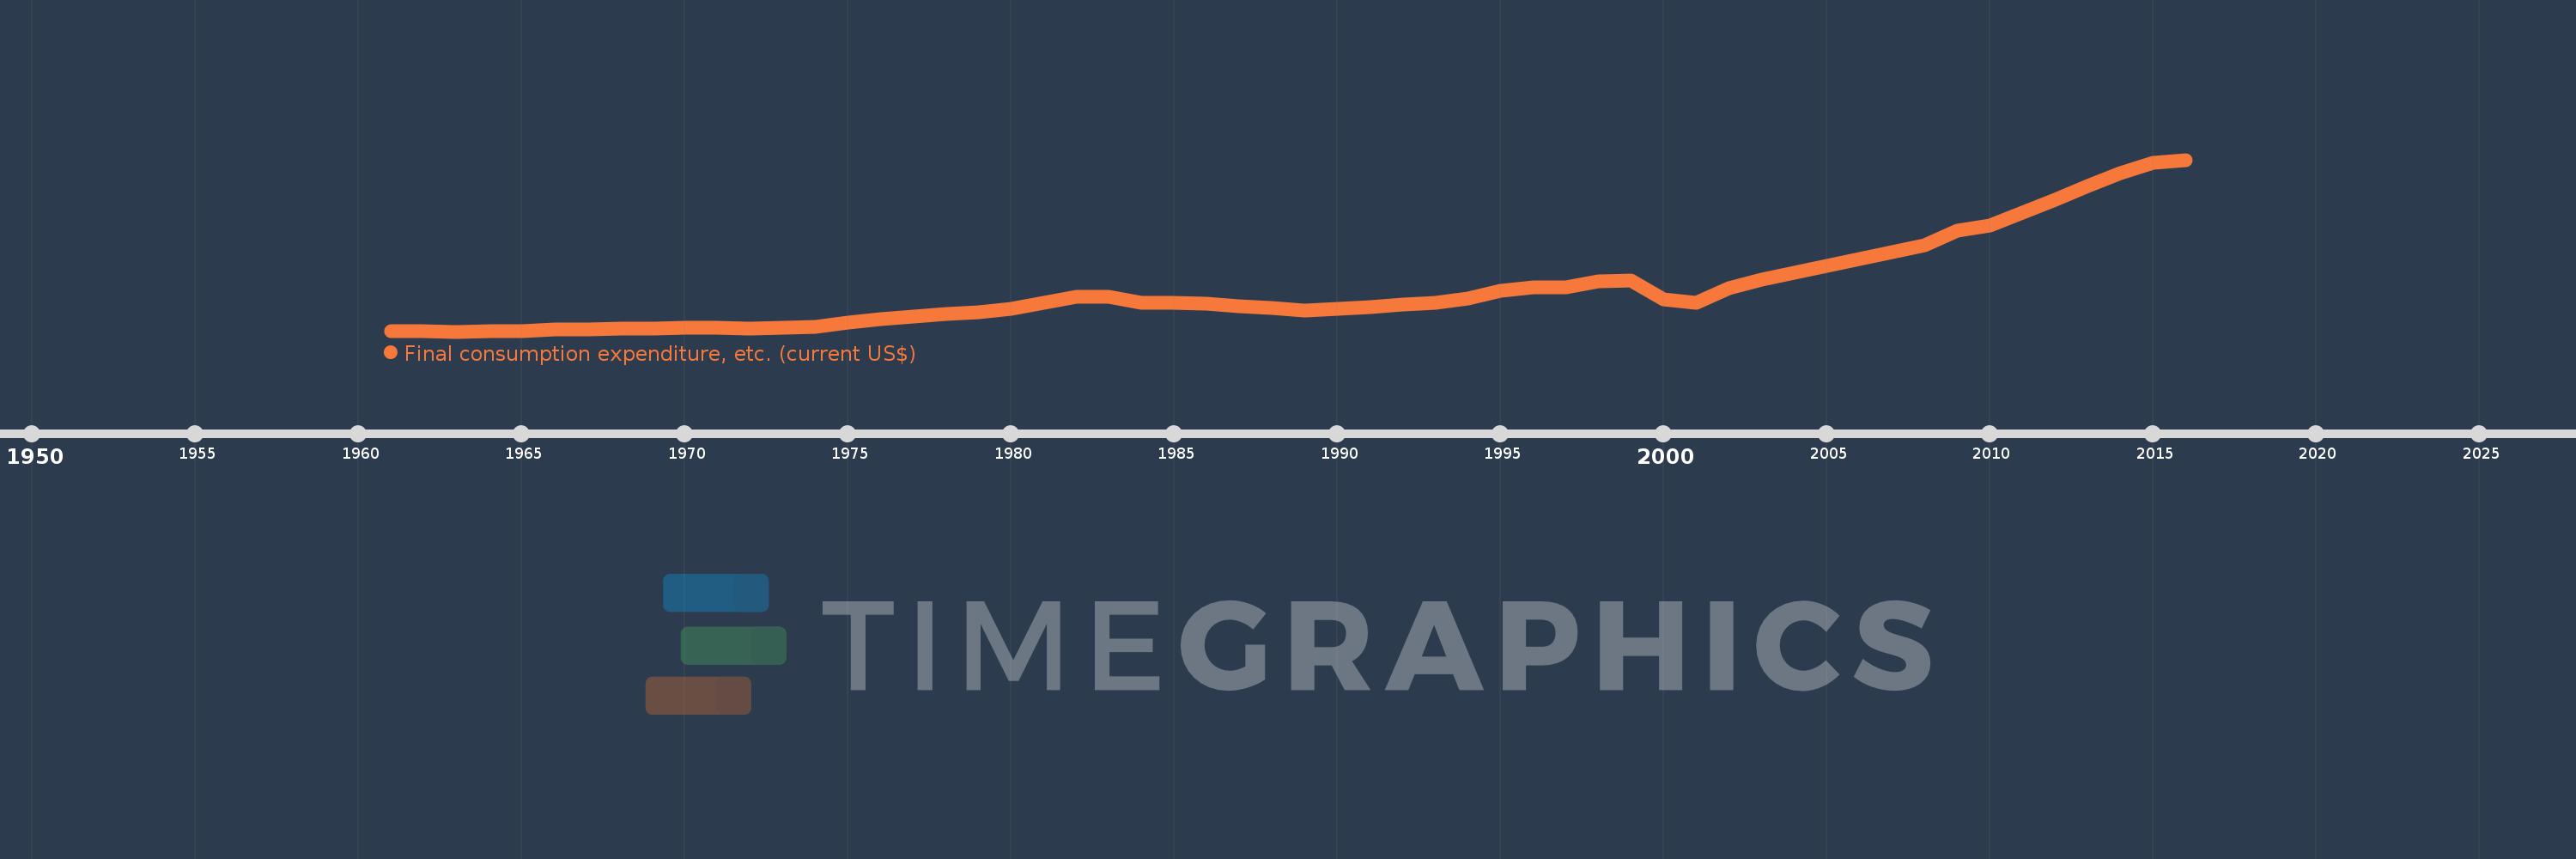
Final consumption expenditure, etc. (current US$)
2016,2015,2014,2013,2012,2011,2010,2009,2008,2007,2006,2005,2004,2003,2002,2001,2000,1999,1998,1997,1996,1995,1994,1993,1992,1991,1990,1989,1988,1987,1986,1985,1984,1983,1982,1981,1980,1979,1978,1977,1976,1975,1974,1973,1972,1971,1970,1969,1968,1967,1966,1965,1964,1963,1962,1961
This statistics in other country:
AfghanistanAlbaniaAlgeriaAngolaAntigua and BarbudaArab WorldArgentinaArmeniaArubaAustraliaAustriaAzerbaijanBahamas, TheBahrainBangladeshBarbadosBelarusBelgiumBelizeBeninBermudaBhutanBoliviaBosnia and HerzegovinaBotswanaBrazilBrunei DarussalamBulgariaBurkina FasoBurundiCabo VerdeCambodiaCameroonCanadaCaribbean small statesCentral African RepublicCentral Europe and the BalticsChadChileChinaColombiaComorosCongo, Dem. Rep.Congo, Rep.Costa RicaCote d'IvoireCroatiaCubaCyprusCzech RepublicDenmarkDjiboutiDominicaDominican RepublicEarly-demographic dividendEast Asia & PacificEast Asia & Pacific (excluding high income)East Asia & Pacific (IDA & IBRD countries)EcuadorEgypt, Arab Rep.El SalvadorEquatorial GuineaEritreaEstoniaEthiopiaEuro areaEurope & Central AsiaEurope & Central Asia (excluding high income)Europe & Central Asia (IDA & IBRD countries)European UnionFaroe IslandsFijiFinlandFragile and conflict affected situationsFranceGabonGambia, TheGeorgiaGermanyGhanaGreeceGrenadaGuatemalaGuineaGuinea-BissauGuyanaHaitiHeavily indebted poor countries (HIPC)High incomeHondurasHong Kong SAR, ChinaHungaryIBRD onlyIcelandIDA & IBRD totalIDA blendIDA onlyIDA totalIndiaIndonesiaIran, Islamic Rep.IraqIrelandIsraelItalyJamaicaJapanJordanKazakhstanKenyaKiribatiKorea, Rep.KosovoKuwaitKyrgyz RepublicLao PDRLate-demographic dividendLatin America & Caribbean Latin America & Caribbean (excluding high income)Latin America & the Caribbean (IDA & IBRD countries)LatviaLeast developed countries: UN classificationLebanonLesothoLiberiaLibyaLithuaniaLow & middle incomeLow incomeLower middle incomeLuxembourgMacao SAR, ChinaMacedonia, FYRMadagascarMalawiMalaysiaMaldivesMaliMaltaMauritaniaMauritiusMexicoMicronesia, Fed. Sts.Middle East & North AfricaMiddle East & North Africa (excluding high income)Middle East & North Africa (IDA & IBRD countries)Middle incomeMoldovaMongoliaMontenegroMoroccoMozambiqueNamibiaNepalNetherlandsNew CaledoniaNew ZealandNicaraguaNigerNigeriaNorth AmericaNorwayOECD membersOmanOther small statesPakistanPanamaPapua New GuineaParaguayPeruPhilippinesPolandPortugalPost-demographic dividendPre-demographic dividendPuerto RicoQatarRomaniaRussian FederationRwandaSaudi ArabiaSenegalSerbiaSeychellesSierra LeoneSingaporeSlovak RepublicSloveniaSmall statesSolomon IslandsSouth AfricaSouth AsiaSouth Asia (IDA & IBRD)South SudanSpainSri LankaSt. Kitts and NevisSt. LuciaSt. Vincent and the GrenadinesSub-Saharan Africa Sub-Saharan Africa (excluding high income)Sub-Saharan Africa (IDA & IBRD countries)SudanSurinameSwazilandSwedenSwitzerlandSyrian Arab RepublicTajikistanTanzaniaThailandTimor-LesteTogoTongaTrinidad and TobagoTunisiaTurkeyTurkmenistanUgandaUkraineUnited Arab EmiratesUnited KingdomUnited StatesUpper middle incomeUruguayUzbekistanVanuatuVenezuela, RBVietnamWest Bank and GazaWorldYemen, Rep.ZambiaZimbabwe Timeline:
This timeline shows a graph from 1961 to 2016 of Ecuador. No data until 1960. Number of actual observations by date: 56.
Source name:
World Development Indicators
Source organization:
World Bank national accounts data, and OECD National Accounts data files.
Categories, topics:
Economy & Growth
Last updated:
apr 23, 2017
Indicators value changes by year
Minimum:
872.484 mln
jan 1, 1963
Maximum:
76.268 bln
jan 1, 2016
At the date of observation
Value
Absolute change
Change from previous value
jan 1, 1961
908.359 mln
+908.359 mln
0.0%
jan 1, 1962
892.283 mln
-16.076 mln
-1.77%
jan 1, 1963
872.484 mln
-19.798 mln
-2.22%
jan 1, 1964
943.929 mln
+71.445 mln
8.19%
jan 1, 1965
1.073 bln
+128.651 mln
13.63%
jan 1, 1966
1.837 bln
+764.157 mln
71.24%
jan 1, 1967
1.901 bln
+64.107 mln
3.49%
jan 1, 1968
2.018 bln
+117.016 mln
6.16%
jan 1, 1969
2.182 bln
+164.557 mln
8.16%
jan 1, 1970
2.524 bln
+342.03 mln
15.67%
jan 1, 1971
2.405 bln
-119.688 mln
-4.74%
jan 1, 1972
2.306 bln
-99.177 mln
-4.12%
jan 1, 1973
2.545 bln
+239.661 mln
10.39%
jan 1, 1974
3.046 bln
+500.296 mln
19.66%
jan 1, 1975
4.716 bln
+1.67 bln
54.84%
jan 1, 1976
6.393 bln
+1.678 bln
35.57%
jan 1, 1977
7.354 bln
+960.972 mln
15.03%
jan 1, 1978
8.529 bln
+1.174 bln
15.97%
jan 1, 1979
9.208 bln
+679.06 mln
7.96%
jan 1, 1980
10.983 bln
+1.775 bln
19.28%
jan 1, 1981
13.474 bln
+2.492 bln
22.69%
jan 1, 1982
16.326 bln
+2.852 bln
21.16%
jan 1, 1983
16.21 bln
-116.088 mln
-0.71%
jan 1, 1984
13.566 bln
-2.644 bln
-16.31%
jan 1, 1985
13.449 bln
-116.583 mln
-0.86%
jan 1, 1986
13.274 bln
-175.538 mln
-1.31%
jan 1, 1987
11.988 bln
-1.286 bln
-9.68%
jan 1, 1988
11.378 bln
-610.152 mln
-5.09%
jan 1, 1989
10.251 bln
-1.127 bln
-9.91%
jan 1, 1990
10.759 bln
+508.399 mln
4.96%
jan 1, 1991
11.429 bln
+669.155 mln
6.22%
jan 1, 1992
12.878 bln
+1.449 bln
12.68%
jan 1, 1993
13.366 bln
+488.381 mln
3.79%
jan 1, 1994
15.534 bln
+2.168 bln
16.22%
jan 1, 1995
18.606 bln
+3.072 bln
19.77%
jan 1, 1996
20.405 bln
+1.799 bln
9.67%
jan 1, 1997
20.467 bln
+61.944 mln
0.3%
jan 1, 1998
22.991 bln
+2.525 bln
12.33%
jan 1, 1999
23.397 bln
+406.17 mln
1.77%
jan 1, 2000
15.091 bln
-8.306 bln
-35.5%
jan 1, 2001
13.55 bln
-1.541 bln
-10.21%
jan 1, 2002
20.052 bln
+6.502 bln
47.99%
jan 1, 2003
23.607 bln
+3.555 bln
17.73%
jan 1, 2004
26.743 bln
+3.136 bln
13.28%
jan 1, 2005
29.77 bln
+3.027 bln
11.32%
jan 1, 2006
32.885 bln
+3.114 bln
10.46%
jan 1, 2007
35.843 bln
+2.958 bln
9.0%
jan 1, 2008
38.775 bln
+2.933 bln
8.18%
jan 1, 2009
45.298 bln
+6.523 bln
16.82%
jan 1, 2010
47.495 bln
+2.197 bln
4.85%
jan 1, 2011
53.193 bln
+5.699 bln
12.0%
jan 1, 2012
58.748 bln
+5.555 bln
10.44%
jan 1, 2013
64.735 bln
+5.987 bln
10.19%
jan 1, 2014
70.265 bln
+5.53 bln
8.54%
jan 1, 2015
74.999 bln
+4.734 bln
6.74%
jan 1, 2016
76.268 bln
+1.268 bln
1.69%
Ranking of countries by current statistics by years


Comments: