29
/
en
AIzaSyAYiBZKx7MnpbEhh9jyipgxe19OcubqV5w
April 1, 2024
150334
Honduras
HND
true
2
1
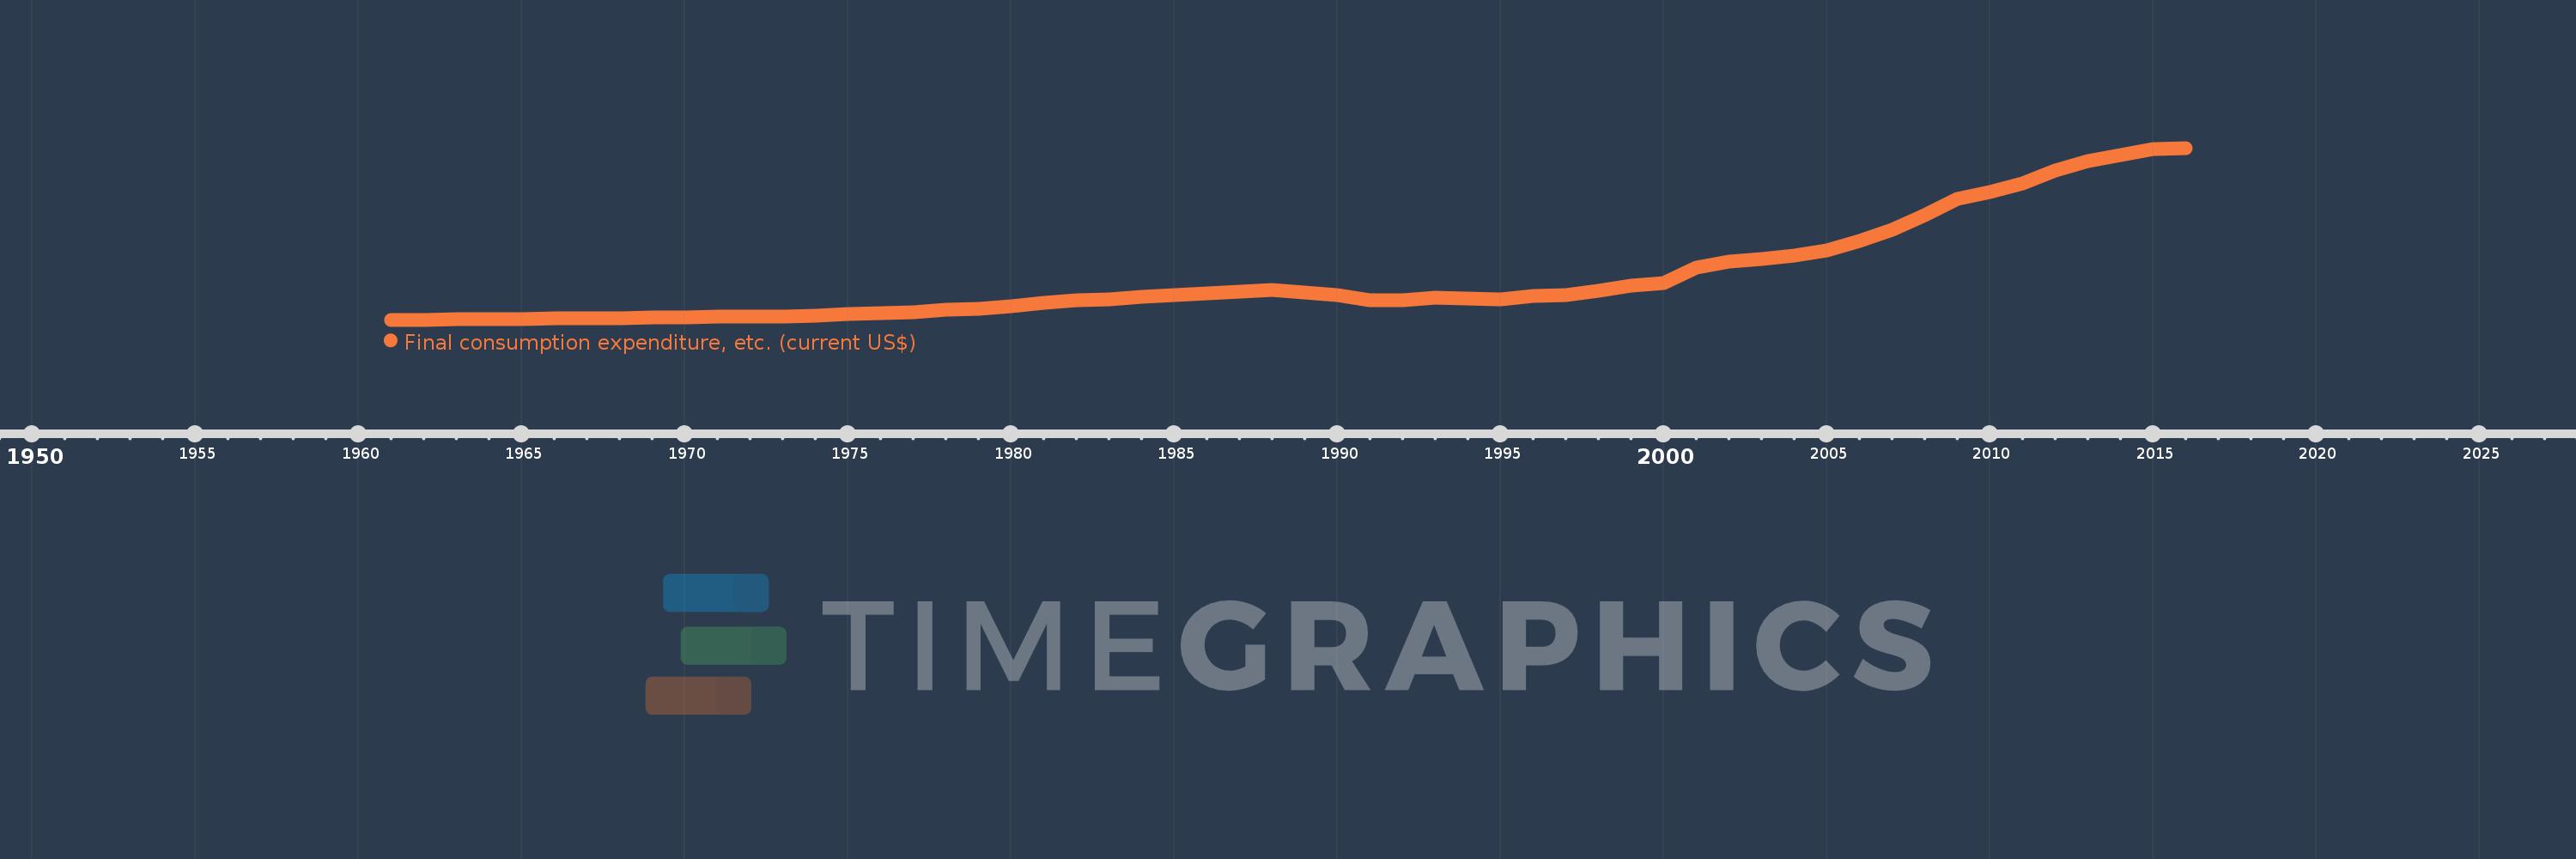
Final consumption expenditure, etc. (current US$)
2016,2015,2014,2013,2012,2011,2010,2009,2008,2007,2006,2005,2004,2003,2002,2001,2000,1999,1998,1997,1996,1995,1994,1993,1992,1991,1990,1989,1988,1987,1986,1985,1984,1983,1982,1981,1980,1979,1978,1977,1976,1975,1974,1973,1972,1971,1970,1969,1968,1967,1966,1965,1964,1963,1962,1961
This statistics in other country:
AfghanistanAlbaniaAlgeriaAngolaAntigua and BarbudaArab WorldArgentinaArmeniaArubaAustraliaAustriaAzerbaijanBahamas, TheBahrainBangladeshBarbadosBelarusBelgiumBelizeBeninBermudaBhutanBoliviaBosnia and HerzegovinaBotswanaBrazilBrunei DarussalamBulgariaBurkina FasoBurundiCabo VerdeCambodiaCameroonCanadaCaribbean small statesCentral African RepublicCentral Europe and the BalticsChadChileChinaColombiaComorosCongo, Dem. Rep.Congo, Rep.Costa RicaCote d'IvoireCroatiaCubaCyprusCzech RepublicDenmarkDjiboutiDominicaDominican RepublicEarly-demographic dividendEast Asia & PacificEast Asia & Pacific (excluding high income)East Asia & Pacific (IDA & IBRD countries)EcuadorEgypt, Arab Rep.El SalvadorEquatorial GuineaEritreaEstoniaEthiopiaEuro areaEurope & Central AsiaEurope & Central Asia (excluding high income)Europe & Central Asia (IDA & IBRD countries)European UnionFaroe IslandsFijiFinlandFragile and conflict affected situationsFranceGabonGambia, TheGeorgiaGermanyGhanaGreeceGrenadaGuatemalaGuineaGuinea-BissauGuyanaHaitiHeavily indebted poor countries (HIPC)High incomeHondurasHong Kong SAR, ChinaHungaryIBRD onlyIcelandIDA & IBRD totalIDA blendIDA onlyIDA totalIndiaIndonesiaIran, Islamic Rep.IraqIrelandIsraelItalyJamaicaJapanJordanKazakhstanKenyaKiribatiKorea, Rep.KosovoKuwaitKyrgyz RepublicLao PDRLate-demographic dividendLatin America & Caribbean Latin America & Caribbean (excluding high income)Latin America & the Caribbean (IDA & IBRD countries)LatviaLeast developed countries: UN classificationLebanonLesothoLiberiaLibyaLithuaniaLow & middle incomeLow incomeLower middle incomeLuxembourgMacao SAR, ChinaMacedonia, FYRMadagascarMalawiMalaysiaMaldivesMaliMaltaMauritaniaMauritiusMexicoMicronesia, Fed. Sts.Middle East & North AfricaMiddle East & North Africa (excluding high income)Middle East & North Africa (IDA & IBRD countries)Middle incomeMoldovaMongoliaMontenegroMoroccoMozambiqueNamibiaNepalNetherlandsNew CaledoniaNew ZealandNicaraguaNigerNigeriaNorth AmericaNorwayOECD membersOmanOther small statesPakistanPanamaPapua New GuineaParaguayPeruPhilippinesPolandPortugalPost-demographic dividendPre-demographic dividendPuerto RicoQatarRomaniaRussian FederationRwandaSaudi ArabiaSenegalSerbiaSeychellesSierra LeoneSingaporeSlovak RepublicSloveniaSmall statesSolomon IslandsSouth AfricaSouth AsiaSouth Asia (IDA & IBRD)South SudanSpainSri LankaSt. Kitts and NevisSt. LuciaSt. Vincent and the GrenadinesSub-Saharan Africa Sub-Saharan Africa (excluding high income)Sub-Saharan Africa (IDA & IBRD countries)SudanSurinameSwazilandSwedenSwitzerlandSyrian Arab RepublicTajikistanTanzaniaThailandTimor-LesteTogoTongaTrinidad and TobagoTunisiaTurkeyTurkmenistanUgandaUkraineUnited Arab EmiratesUnited KingdomUnited StatesUpper middle incomeUruguayUzbekistanVanuatuVenezuela, RBVietnamWest Bank and GazaWorldYemen, Rep.ZambiaZimbabwe Timeline:
This timeline shows a graph from 1961 to 2016 of Honduras. No data until 1960. Number of actual observations by date: 56.
Source name:
World Development Indicators
Source organization:
World Bank national accounts data, and OECD National Accounts data files.
Categories, topics:
Economy & Growth
Last updated:
apr 23, 2017
Indicators value changes by year
Minimum:
294.5 mln
jan 1, 1961
Maximum:
18.906 bln
jan 1, 2016
At the date of observation
Value
Absolute change
Change from previous value
jan 1, 1961
294.5 mln
+294.5 mln
0.0%
jan 1, 1962
311.4 mln
+16.9 mln
5.74%
jan 1, 1963
328.4 mln
+17.0 mln
5.46%
jan 1, 1964
355.55 mln
+27.15 mln
8.27%
jan 1, 1965
400.6 mln
+45.05 mln
12.67%
jan 1, 1966
432.0 mln
+31.4 mln
7.84%
jan 1, 1967
469.75 mln
+37.75 mln
8.74%
jan 1, 1968
492.65 mln
+22.9 mln
4.87%
jan 1, 1969
534.95 mln
+42.3 mln
8.59%
jan 1, 1970
557.9 mln
+22.95 mln
4.29%
jan 1, 1971
616.8 mln
+58.9 mln
10.56%
jan 1, 1972
612.0 mln
-4.8 mln
-0.78%
jan 1, 1973
666.5 mln
+54.5 mln
8.91%
jan 1, 1974
746.5 mln
+80.0 mln
12.0%
jan 1, 1975
887.0 mln
+140.5 mln
18.82%
jan 1, 1976
1.012 bln
+125.0 mln
14.09%
jan 1, 1977
1.149 bln
+137.0 mln
13.54%
jan 1, 1978
1.358 bln
+209.5 mln
18.23%
jan 1, 1979
1.496 bln
+138.0 mln
10.16%
jan 1, 1980
1.732 bln
+235.0 mln
15.7%
jan 1, 1981
2.106 bln
+374.0 mln
21.6%
jan 1, 1982
2.397 bln
+291.0 mln
13.82%
jan 1, 1983
2.534 bln
+137.5 mln
5.74%
jan 1, 1984
2.745 bln
+211.5 mln
8.35%
jan 1, 1985
2.951 bln
+205.5 mln
7.48%
jan 1, 1986
3.183 bln
+231.5 mln
7.84%
jan 1, 1987
3.347 bln
+164.0 mln
5.15%
jan 1, 1988
3.548 bln
+202.0 mln
6.04%
jan 1, 1989
3.242 bln
-306.869 mln
-8.65%
jan 1, 1990
3.0 bln
-241.286 mln
-7.44%
jan 1, 1991
2.432 bln
-568.438 mln
-18.95%
jan 1, 1992
2.406 bln
-26.279 mln
-1.08%
jan 1, 1993
2.672 bln
+266.484 mln
11.08%
jan 1, 1994
2.628 bln
-44.466 mln
-1.66%
jan 1, 1995
2.485 bln
-142.868 mln
-5.44%
jan 1, 1996
2.848 bln
+363.397 mln
14.62%
jan 1, 1997
2.985 bln
+136.453 mln
4.79%
jan 1, 1998
3.426 bln
+441.075 mln
14.78%
jan 1, 1999
3.992 bln
+565.951 mln
16.52%
jan 1, 2000
4.313 bln
+321.516 mln
8.05%
jan 1, 2001
5.978 bln
+1.665 bln
38.61%
jan 1, 2002
6.596 bln
+617.55 mln
10.33%
jan 1, 2003
6.864 bln
+267.834 mln
4.06%
jan 1, 2004
7.227 bln
+363.219 mln
5.29%
jan 1, 2005
7.803 bln
+575.977 mln
7.97%
jan 1, 2006
8.788 bln
+984.665 mln
12.62%
jan 1, 2007
10.048 bln
+1.261 bln
14.35%
jan 1, 2008
11.587 bln
+1.538 bln
15.31%
jan 1, 2009
13.381 bln
+1.794 bln
15.48%
jan 1, 2010
14.087 bln
+706.545 mln
5.28%
jan 1, 2011
15.107 bln
+1.02 bln
7.24%
jan 1, 2012
16.48 bln
+1.373 bln
9.09%
jan 1, 2013
17.447 bln
+966.781 mln
5.87%
jan 1, 2014
18.126 bln
+679.387 mln
3.89%
jan 1, 2015
18.763 bln
+636.406 mln
3.51%
jan 1, 2016
18.906 bln
+142.925 mln
0.76%
Ranking of countries by current statistics by years


Comments: