29
/
en
AIzaSyAYiBZKx7MnpbEhh9jyipgxe19OcubqV5w
April 1, 2024
79413
Barbados
BRB
true
2
1
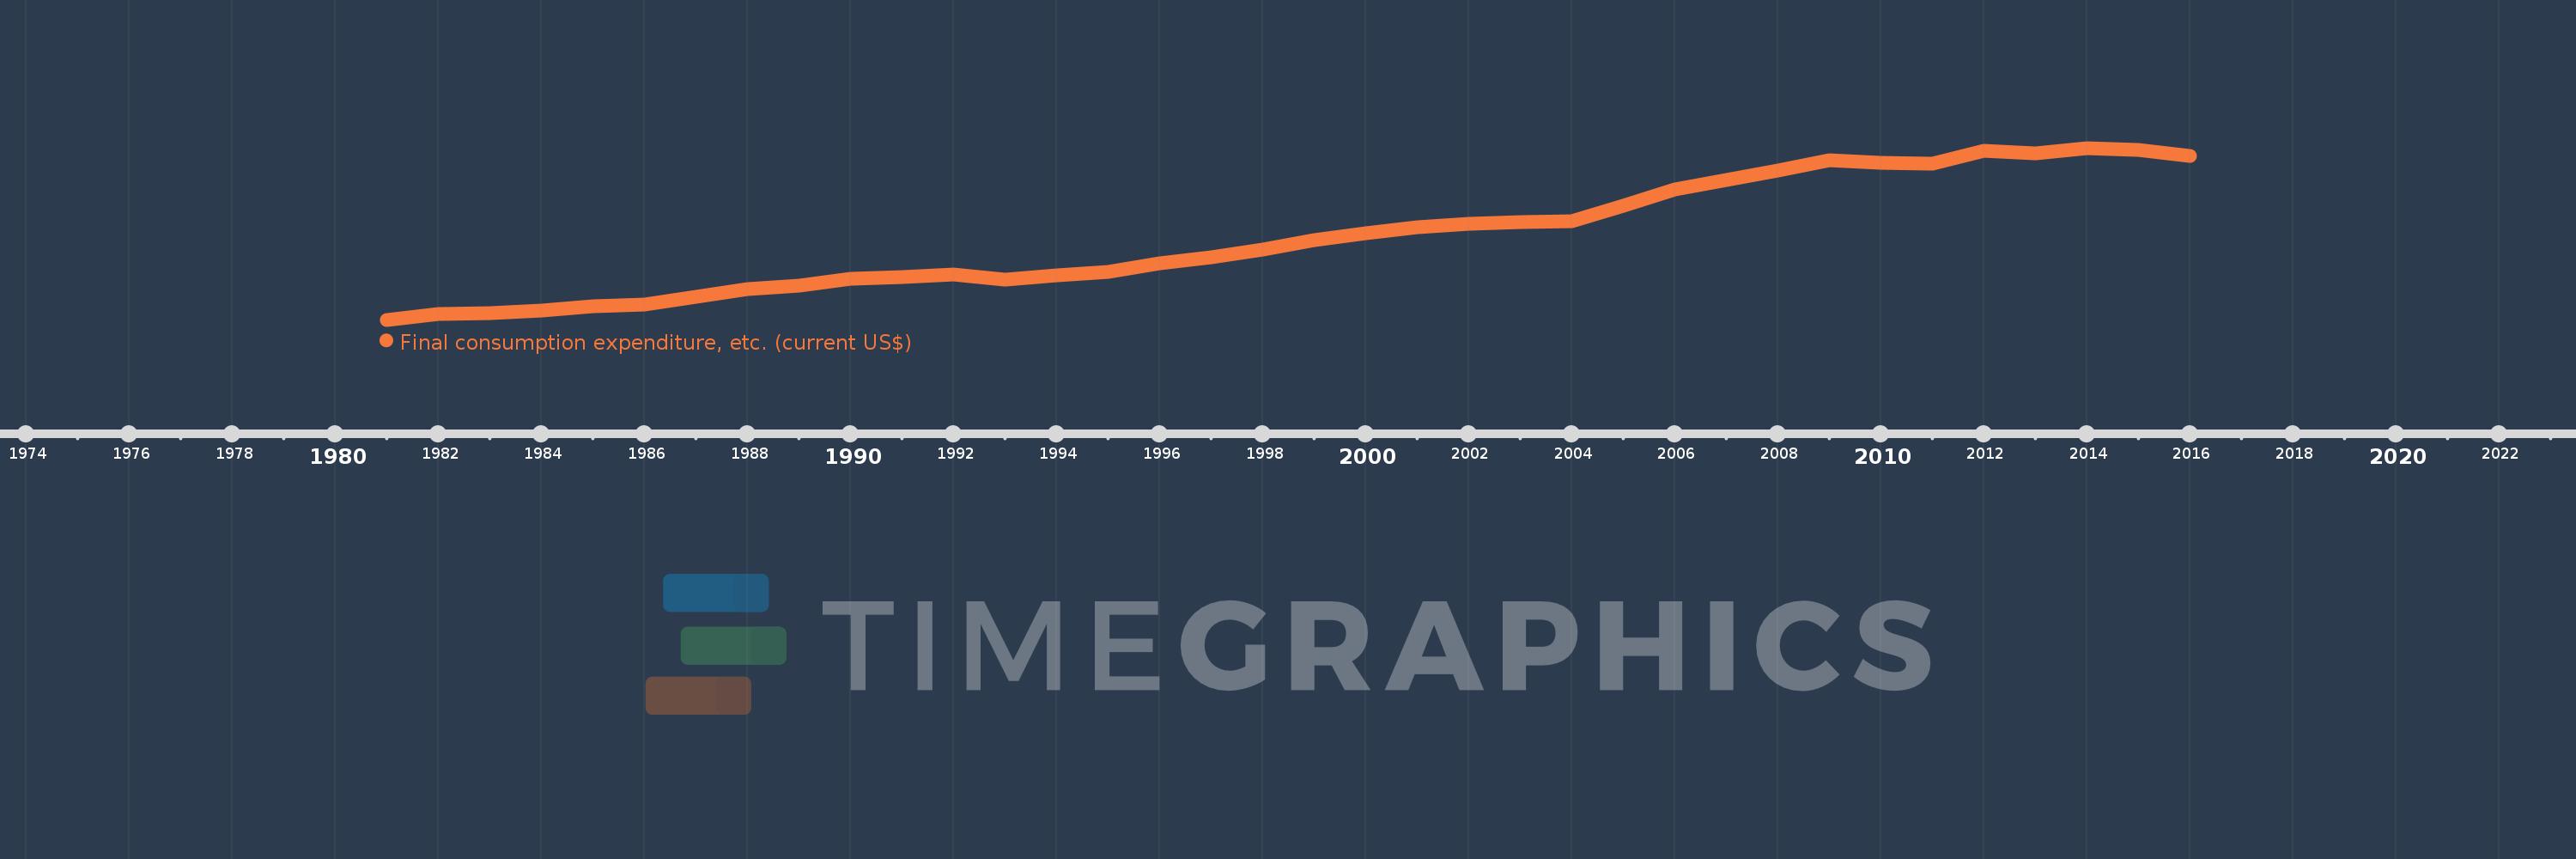
Final consumption expenditure, etc. (current US$)
2016,2015,2014,2013,2012,2011,2010,2009,2008,2007,2006,2005,2004,2003,2002,2001,2000,1999,1998,1997,1996,1995,1994,1993,1992,1991,1990,1989,1988,1987,1986,1985,1984,1983,1982,1981
This statistics in other country:
AfghanistanAlbaniaAlgeriaAngolaAntigua and BarbudaArab WorldArgentinaArmeniaArubaAustraliaAustriaAzerbaijanBahamas, TheBahrainBangladeshBarbadosBelarusBelgiumBelizeBeninBermudaBhutanBoliviaBosnia and HerzegovinaBotswanaBrazilBrunei DarussalamBulgariaBurkina FasoBurundiCabo VerdeCambodiaCameroonCanadaCaribbean small statesCentral African RepublicCentral Europe and the BalticsChadChileChinaColombiaComorosCongo, Dem. Rep.Congo, Rep.Costa RicaCote d'IvoireCroatiaCubaCyprusCzech RepublicDenmarkDjiboutiDominicaDominican RepublicEarly-demographic dividendEast Asia & PacificEast Asia & Pacific (excluding high income)East Asia & Pacific (IDA & IBRD countries)EcuadorEgypt, Arab Rep.El SalvadorEquatorial GuineaEritreaEstoniaEthiopiaEuro areaEurope & Central AsiaEurope & Central Asia (excluding high income)Europe & Central Asia (IDA & IBRD countries)European UnionFaroe IslandsFijiFinlandFragile and conflict affected situationsFranceGabonGambia, TheGeorgiaGermanyGhanaGreeceGrenadaGuatemalaGuineaGuinea-BissauGuyanaHaitiHeavily indebted poor countries (HIPC)High incomeHondurasHong Kong SAR, ChinaHungaryIBRD onlyIcelandIDA & IBRD totalIDA blendIDA onlyIDA totalIndiaIndonesiaIran, Islamic Rep.IraqIrelandIsraelItalyJamaicaJapanJordanKazakhstanKenyaKiribatiKorea, Rep.KosovoKuwaitKyrgyz RepublicLao PDRLate-demographic dividendLatin America & Caribbean Latin America & Caribbean (excluding high income)Latin America & the Caribbean (IDA & IBRD countries)LatviaLeast developed countries: UN classificationLebanonLesothoLiberiaLibyaLithuaniaLow & middle incomeLow incomeLower middle incomeLuxembourgMacao SAR, ChinaMacedonia, FYRMadagascarMalawiMalaysiaMaldivesMaliMaltaMauritaniaMauritiusMexicoMicronesia, Fed. Sts.Middle East & North AfricaMiddle East & North Africa (excluding high income)Middle East & North Africa (IDA & IBRD countries)Middle incomeMoldovaMongoliaMontenegroMoroccoMozambiqueNamibiaNepalNetherlandsNew CaledoniaNew ZealandNicaraguaNigerNigeriaNorth AmericaNorwayOECD membersOmanOther small statesPakistanPanamaPapua New GuineaParaguayPeruPhilippinesPolandPortugalPost-demographic dividendPre-demographic dividendPuerto RicoQatarRomaniaRussian FederationRwandaSaudi ArabiaSenegalSerbiaSeychellesSierra LeoneSingaporeSlovak RepublicSloveniaSmall statesSolomon IslandsSouth AfricaSouth AsiaSouth Asia (IDA & IBRD)South SudanSpainSri LankaSt. Kitts and NevisSt. LuciaSt. Vincent and the GrenadinesSub-Saharan Africa Sub-Saharan Africa (excluding high income)Sub-Saharan Africa (IDA & IBRD countries)SudanSurinameSwazilandSwedenSwitzerlandSyrian Arab RepublicTajikistanTanzaniaThailandTimor-LesteTogoTongaTrinidad and TobagoTunisiaTurkeyTurkmenistanUgandaUkraineUnited Arab EmiratesUnited KingdomUnited StatesUpper middle incomeUruguayUzbekistanVanuatuVenezuela, RBVietnamWest Bank and GazaWorldYemen, Rep.ZambiaZimbabwe Timeline:
This timeline shows a graph from 1981 to 2016 of Barbados. No data until 1980. Number of actual observations by date: 36.
Source name:
World Development Indicators
Source organization:
World Bank national accounts data, and OECD National Accounts data files.
Categories, topics:
Economy & Growth
Last updated:
apr 23, 2017
Indicators value changes by year
Minimum:
770.945 mln
jan 1, 1981
Maximum:
4.352 bln
jan 1, 2014
At the date of observation
Value
Absolute change
Change from previous value
jan 1, 1981
770.945 mln
+770.945 mln
0.0%
jan 1, 1982
892.389 mln
+121.444 mln
15.75%
jan 1, 1983
917.171 mln
+24.782 mln
2.78%
jan 1, 1984
958.848 mln
+41.678 mln
4.54%
jan 1, 1985
1.048 bln
+88.979 mln
9.28%
jan 1, 1986
1.079 bln
+31.15 mln
2.97%
jan 1, 1987
1.253 bln
+174.128 mln
16.14%
jan 1, 1988
1.417 bln
+163.51 mln
13.05%
jan 1, 1989
1.482 bln
+64.986 mln
4.59%
jan 1, 1990
1.619 bln
+137.354 mln
9.27%
jan 1, 1991
1.67 bln
+50.695 mln
3.13%
jan 1, 1992
1.713 bln
+43.687 mln
2.62%
jan 1, 1993
1.61 bln
-103.793 mln
-6.06%
jan 1, 1994
1.689 bln
+79.49 mln
4.94%
jan 1, 1995
1.76 bln
+71.411 mln
4.23%
jan 1, 1996
1.953 bln
+192.898 mln
10.96%
jan 1, 1997
2.065 bln
+111.566 mln
5.71%
jan 1, 1998
2.233 bln
+168.389 mln
8.15%
jan 1, 1999
2.433 bln
+200.01 mln
8.96%
jan 1, 2000
2.578 bln
+144.967 mln
5.96%
jan 1, 2001
2.693 bln
+114.997 mln
4.46%
jan 1, 2002
2.774 bln
+81.013 mln
3.01%
jan 1, 2003
2.8 bln
+25.58 mln
0.92%
jan 1, 2004
2.823 bln
+22.794 mln
0.81%
jan 1, 2005
3.151 bln
+327.864 mln
11.62%
jan 1, 2006
3.48 bln
+329.397 mln
10.46%
jan 1, 2007
3.688 bln
+208.458 mln
5.99%
jan 1, 2008
3.885 bln
+196.29 mln
5.32%
jan 1, 2009
4.102 bln
+217.199 mln
5.59%
jan 1, 2010
4.051 bln
-51.3 mln
-1.25%
jan 1, 2011
4.029 bln
-21.395 mln
-0.53%
jan 1, 2012
4.299 bln
+269.707 mln
6.69%
jan 1, 2013
4.232 bln
-66.647 mln
-1.55%
jan 1, 2014
4.352 bln
+120.16 mln
2.84%
jan 1, 2015
4.308 bln
-44.756 mln
-1.03%
jan 1, 2016
4.178 bln
-129.942 mln
-3.02%
Ranking of countries by current statistics by years


Comments: