29
/
en
AIzaSyAYiBZKx7MnpbEhh9jyipgxe19OcubqV5w
April 1, 2024
282254
Vietnam
VNM
true
2
1
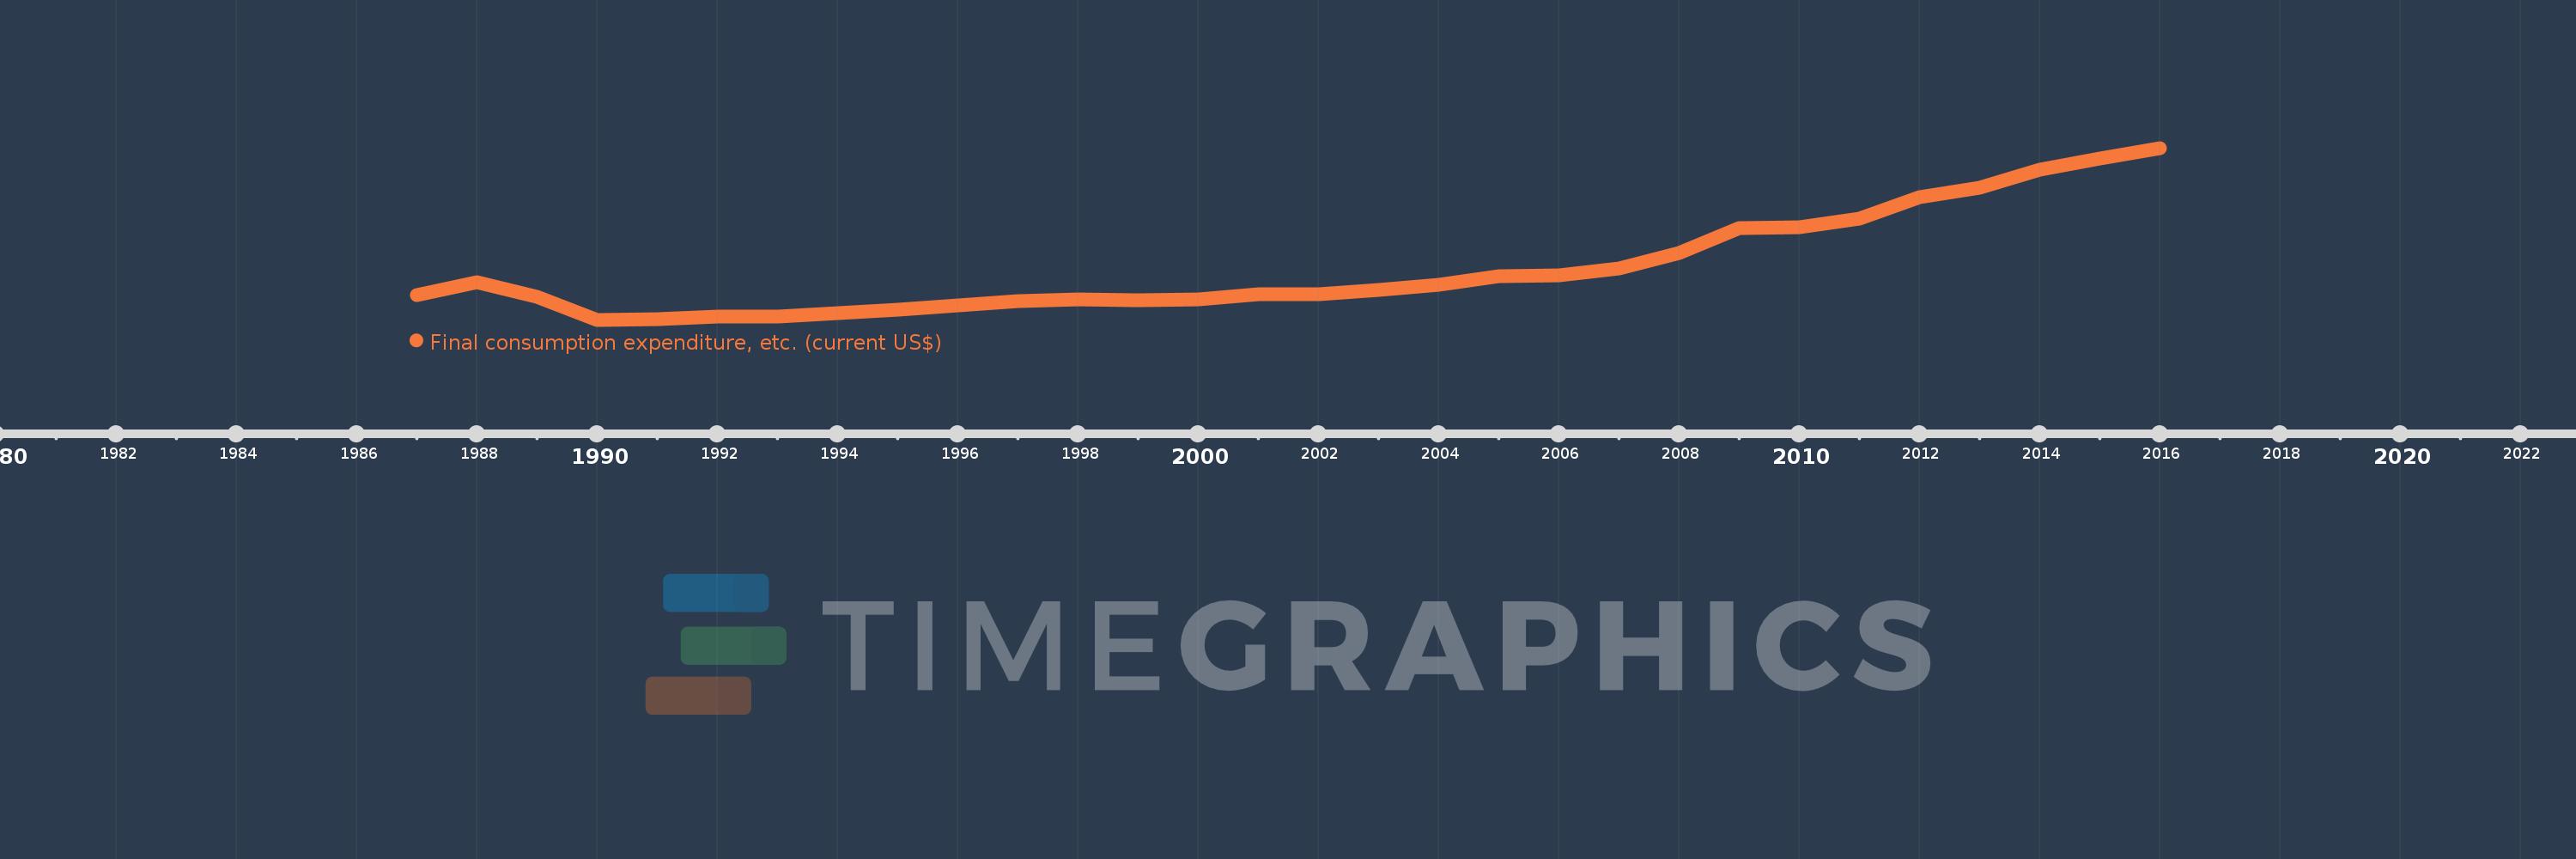
Final consumption expenditure, etc. (current US$)
2016,2015,2014,2013,2012,2011,2010,2009,2008,2007,2006,2005,2004,2003,2002,2001,2000,1999,1998,1997,1996,1995,1994,1993,1992,1991,1990,1989,1988,1987
This statistics in other country:
AfghanistanAlbaniaAlgeriaAngolaAntigua and BarbudaArab WorldArgentinaArmeniaArubaAustraliaAustriaAzerbaijanBahamas, TheBahrainBangladeshBarbadosBelarusBelgiumBelizeBeninBermudaBhutanBoliviaBosnia and HerzegovinaBotswanaBrazilBrunei DarussalamBulgariaBurkina FasoBurundiCabo VerdeCambodiaCameroonCanadaCaribbean small statesCentral African RepublicCentral Europe and the BalticsChadChileChinaColombiaComorosCongo, Dem. Rep.Congo, Rep.Costa RicaCote d'IvoireCroatiaCubaCyprusCzech RepublicDenmarkDjiboutiDominicaDominican RepublicEarly-demographic dividendEast Asia & PacificEast Asia & Pacific (excluding high income)East Asia & Pacific (IDA & IBRD countries)EcuadorEgypt, Arab Rep.El SalvadorEquatorial GuineaEritreaEstoniaEthiopiaEuro areaEurope & Central AsiaEurope & Central Asia (excluding high income)Europe & Central Asia (IDA & IBRD countries)European UnionFaroe IslandsFijiFinlandFragile and conflict affected situationsFranceGabonGambia, TheGeorgiaGermanyGhanaGreeceGrenadaGuatemalaGuineaGuinea-BissauGuyanaHaitiHeavily indebted poor countries (HIPC)High incomeHondurasHong Kong SAR, ChinaHungaryIBRD onlyIcelandIDA & IBRD totalIDA blendIDA onlyIDA totalIndiaIndonesiaIran, Islamic Rep.IraqIrelandIsraelItalyJamaicaJapanJordanKazakhstanKenyaKiribatiKorea, Rep.KosovoKuwaitKyrgyz RepublicLao PDRLate-demographic dividendLatin America & Caribbean Latin America & Caribbean (excluding high income)Latin America & the Caribbean (IDA & IBRD countries)LatviaLeast developed countries: UN classificationLebanonLesothoLiberiaLibyaLithuaniaLow & middle incomeLow incomeLower middle incomeLuxembourgMacao SAR, ChinaMacedonia, FYRMadagascarMalawiMalaysiaMaldivesMaliMaltaMauritaniaMauritiusMexicoMicronesia, Fed. Sts.Middle East & North AfricaMiddle East & North Africa (excluding high income)Middle East & North Africa (IDA & IBRD countries)Middle incomeMoldovaMongoliaMontenegroMoroccoMozambiqueNamibiaNepalNetherlandsNew CaledoniaNew ZealandNicaraguaNigerNigeriaNorth AmericaNorwayOECD membersOmanOther small statesPakistanPanamaPapua New GuineaParaguayPeruPhilippinesPolandPortugalPost-demographic dividendPre-demographic dividendPuerto RicoQatarRomaniaRussian FederationRwandaSaudi ArabiaSenegalSerbiaSeychellesSierra LeoneSingaporeSlovak RepublicSloveniaSmall statesSolomon IslandsSouth AfricaSouth AsiaSouth Asia (IDA & IBRD)South SudanSpainSri LankaSt. Kitts and NevisSt. LuciaSt. Vincent and the GrenadinesSub-Saharan Africa Sub-Saharan Africa (excluding high income)Sub-Saharan Africa (IDA & IBRD countries)SudanSurinameSwazilandSwedenSwitzerlandSyrian Arab RepublicTajikistanTanzaniaThailandTimor-LesteTogoTongaTrinidad and TobagoTunisiaTurkeyTurkmenistanUgandaUkraineUnited Arab EmiratesUnited KingdomUnited StatesUpper middle incomeUruguayUzbekistanVanuatuVenezuela, RBVietnamWest Bank and GazaWorldYemen, Rep.ZambiaZimbabwe Timeline:
This timeline shows a graph from 1987 to 2016 of Vietnam. No data until 1986. Number of actual observations by date: 30.
Source name:
World Development Indicators
Source organization:
World Bank national accounts data, and OECD National Accounts data files.
Categories, topics:
Economy & Growth
Last updated:
apr 23, 2017
Indicators value changes by year
Minimum:
6.015 bln
jan 1, 1990
Maximum:
138.486 bln
jan 1, 2016
At the date of observation
Value
Absolute change
Change from previous value
jan 1, 1987
25.165 bln
+25.165 bln
0.0%
jan 1, 1988
34.911 bln
+9.747 bln
38.73%
jan 1, 1989
23.699 bln
-11.212 bln
-32.12%
jan 1, 1990
6.015 bln
-17.684 bln
-74.62%
jan 1, 1991
6.256 bln
+241.572 mln
4.02%
jan 1, 1992
8.657 bln
+2.4 bln
38.36%
jan 1, 1993
8.53 bln
-126.933 mln
-1.47%
jan 1, 1994
11.139 bln
+2.61 bln
30.6%
jan 1, 1995
13.676 bln
+2.536 bln
22.77%
jan 1, 1996
16.994 bln
+3.318 bln
24.26%
jan 1, 1997
20.433 bln
+3.439 bln
20.24%
jan 1, 1998
21.432 bln
+999.246 mln
4.89%
jan 1, 1999
21.293 bln
-139.064 mln
-0.65%
jan 1, 2000
21.577 bln
+284.517 mln
1.34%
jan 1, 2001
25.524 bln
+3.947 bln
18.29%
jan 1, 2002
25.701 bln
+177.215 mln
0.69%
jan 1, 2003
28.831 bln
+3.129 bln
12.18%
jan 1, 2004
33.041 bln
+4.211 bln
14.6%
jan 1, 2005
39.47 bln
+6.429 bln
19.46%
jan 1, 2006
40.089 bln
+618.356 mln
1.57%
jan 1, 2007
45.361 bln
+5.272 bln
13.15%
jan 1, 2008
57.289 bln
+11.929 bln
26.3%
jan 1, 2009
76.48 bln
+19.191 bln
33.5%
jan 1, 2010
77.608 bln
+1.128 bln
1.47%
jan 1, 2011
84.072 bln
+6.465 bln
8.33%
jan 1, 2012
100.817 bln
+16.745 bln
19.92%
jan 1, 2013
107.911 bln
+7.093 bln
7.04%
jan 1, 2014
121.852 bln
+13.942 bln
12.92%
jan 1, 2015
130.143 bln
+8.29 bln
6.8%
jan 1, 2016
138.486 bln
+8.343 bln
6.41%
Ranking of countries by current statistics by years


Comments: