29
/
en
AIzaSyAYiBZKx7MnpbEhh9jyipgxe19OcubqV5w
April 1, 2024
65964
Algeria
DZA
true
2
1
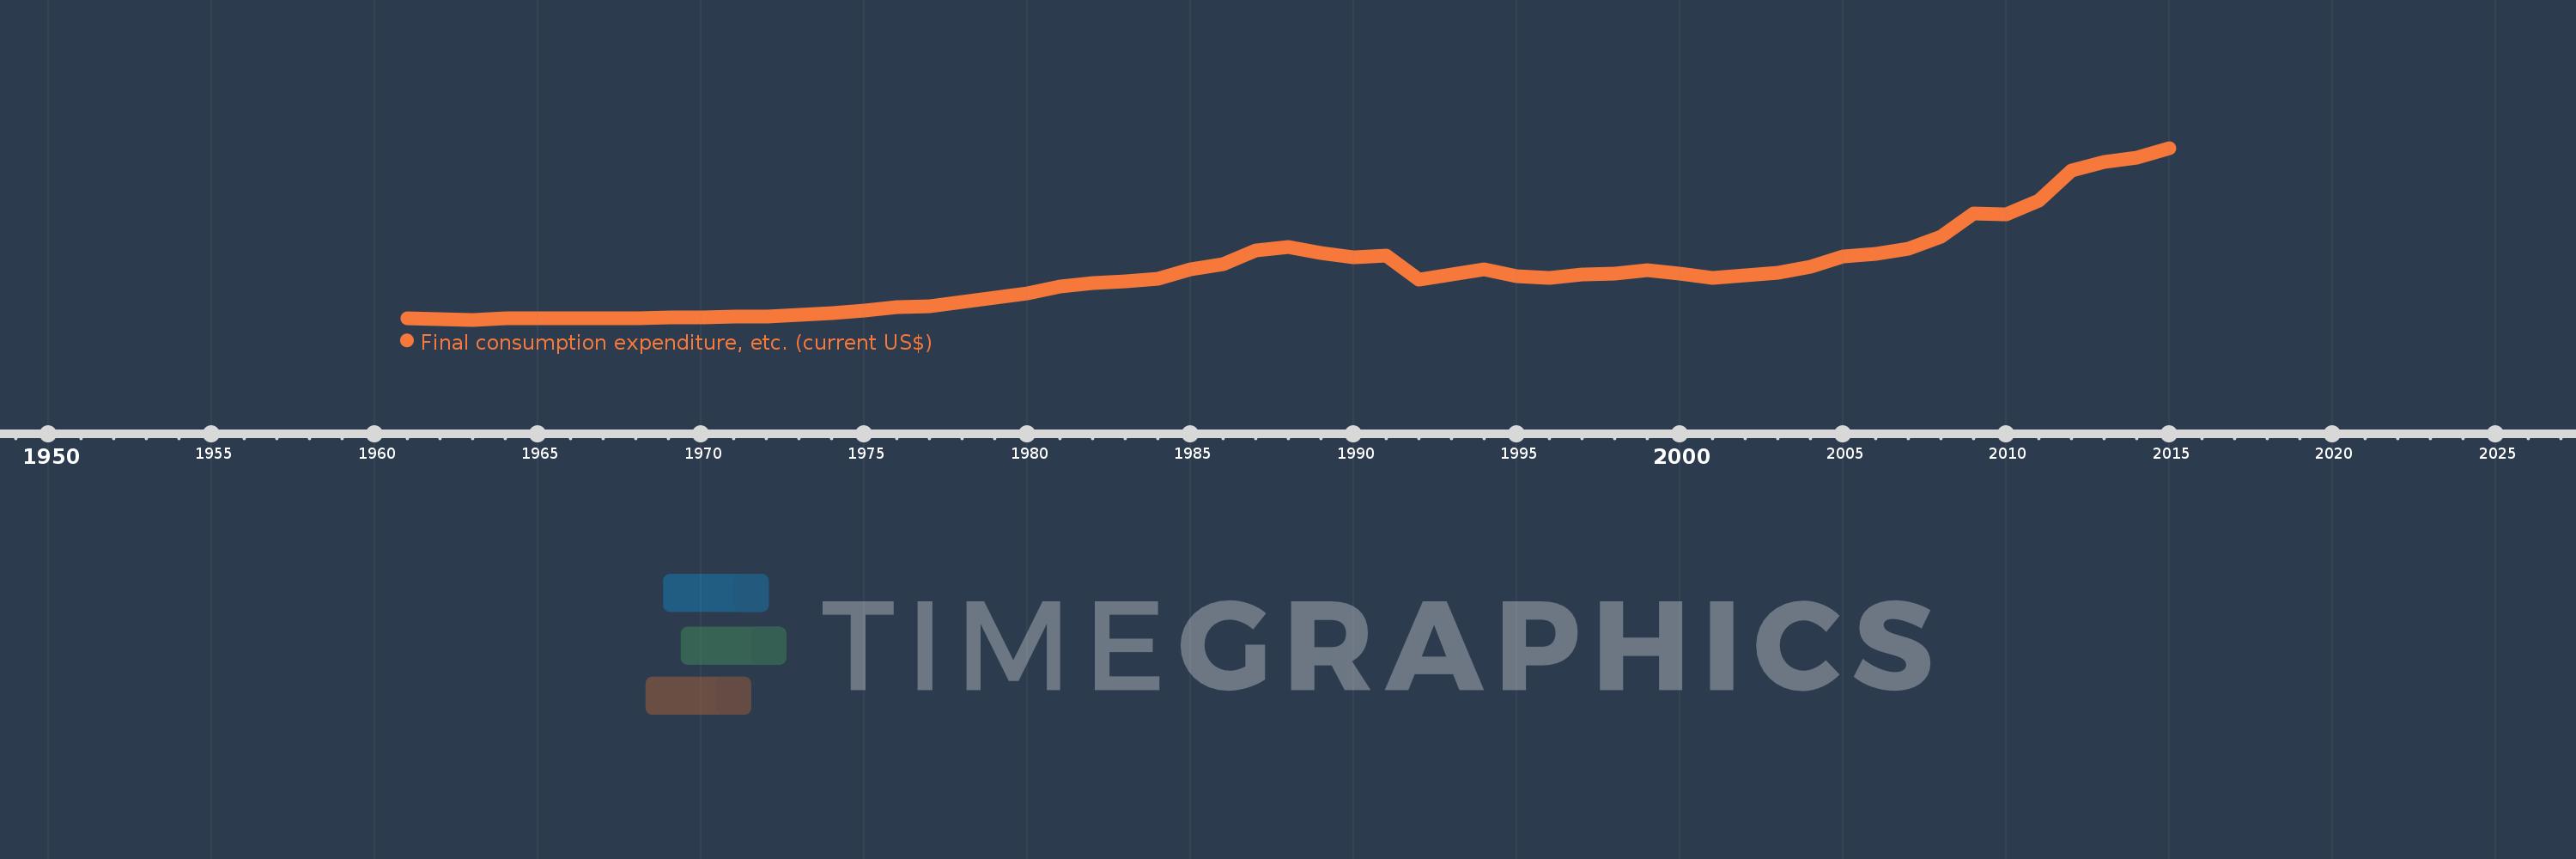
Final consumption expenditure, etc. (current US$)
2015,2014,2013,2012,2011,2010,2009,2008,2007,2006,2005,2004,2003,2002,2001,2000,1999,1998,1997,1996,1995,1994,1993,1992,1991,1990,1989,1988,1987,1986,1985,1984,1983,1982,1981,1980,1979,1978,1977,1976,1975,1974,1973,1972,1971,1970,1969,1968,1967,1966,1965,1964,1963,1962,1961
This statistics in other country:
AfghanistanAlbaniaAlgeriaAngolaAntigua and BarbudaArab WorldArgentinaArmeniaArubaAustraliaAustriaAzerbaijanBahamas, TheBahrainBangladeshBarbadosBelarusBelgiumBelizeBeninBermudaBhutanBoliviaBosnia and HerzegovinaBotswanaBrazilBrunei DarussalamBulgariaBurkina FasoBurundiCabo VerdeCambodiaCameroonCanadaCaribbean small statesCentral African RepublicCentral Europe and the BalticsChadChileChinaColombiaComorosCongo, Dem. Rep.Congo, Rep.Costa RicaCote d'IvoireCroatiaCubaCyprusCzech RepublicDenmarkDjiboutiDominicaDominican RepublicEarly-demographic dividendEast Asia & PacificEast Asia & Pacific (excluding high income)East Asia & Pacific (IDA & IBRD countries)EcuadorEgypt, Arab Rep.El SalvadorEquatorial GuineaEritreaEstoniaEthiopiaEuro areaEurope & Central AsiaEurope & Central Asia (excluding high income)Europe & Central Asia (IDA & IBRD countries)European UnionFaroe IslandsFijiFinlandFragile and conflict affected situationsFranceGabonGambia, TheGeorgiaGermanyGhanaGreeceGrenadaGuatemalaGuineaGuinea-BissauGuyanaHaitiHeavily indebted poor countries (HIPC)High incomeHondurasHong Kong SAR, ChinaHungaryIBRD onlyIcelandIDA & IBRD totalIDA blendIDA onlyIDA totalIndiaIndonesiaIran, Islamic Rep.IraqIrelandIsraelItalyJamaicaJapanJordanKazakhstanKenyaKiribatiKorea, Rep.KosovoKuwaitKyrgyz RepublicLao PDRLate-demographic dividendLatin America & Caribbean Latin America & Caribbean (excluding high income)Latin America & the Caribbean (IDA & IBRD countries)LatviaLeast developed countries: UN classificationLebanonLesothoLiberiaLibyaLithuaniaLow & middle incomeLow incomeLower middle incomeLuxembourgMacao SAR, ChinaMacedonia, FYRMadagascarMalawiMalaysiaMaldivesMaliMaltaMauritaniaMauritiusMexicoMicronesia, Fed. Sts.Middle East & North AfricaMiddle East & North Africa (excluding high income)Middle East & North Africa (IDA & IBRD countries)Middle incomeMoldovaMongoliaMontenegroMoroccoMozambiqueNamibiaNepalNetherlandsNew CaledoniaNew ZealandNicaraguaNigerNigeriaNorth AmericaNorwayOECD membersOmanOther small statesPakistanPanamaPapua New GuineaParaguayPeruPhilippinesPolandPortugalPost-demographic dividendPre-demographic dividendPuerto RicoQatarRomaniaRussian FederationRwandaSaudi ArabiaSenegalSerbiaSeychellesSierra LeoneSingaporeSlovak RepublicSloveniaSmall statesSolomon IslandsSouth AfricaSouth AsiaSouth Asia (IDA & IBRD)South SudanSpainSri LankaSt. Kitts and NevisSt. LuciaSt. Vincent and the GrenadinesSub-Saharan Africa Sub-Saharan Africa (excluding high income)Sub-Saharan Africa (IDA & IBRD countries)SudanSurinameSwazilandSwedenSwitzerlandSyrian Arab RepublicTajikistanTanzaniaThailandTimor-LesteTogoTongaTrinidad and TobagoTunisiaTurkeyTurkmenistanUgandaUkraineUnited Arab EmiratesUnited KingdomUnited StatesUpper middle incomeUruguayUzbekistanVanuatuVenezuela, RBVietnamWest Bank and GazaWorldYemen, Rep.ZambiaZimbabwe Timeline:
This timeline shows a graph from 1961 to 2015 of Algeria. No data until 1960. Number of actual observations by date: 55.
Source name:
World Development Indicators
Source organization:
World Bank national accounts data, and OECD National Accounts data files.
Categories, topics:
Economy & Growth
Last updated:
apr 23, 2017
Indicators value changes by year
Minimum:
1.313 bln
jan 1, 1963
Maximum:
119.24 bln
jan 1, 2015
At the date of observation
Value
Absolute change
Change from previous value
jan 1, 1961
2.34 bln
+2.34 bln
0.0%
jan 1, 1962
1.803 bln
-536.613 mln
-22.93%
jan 1, 1963
1.313 bln
-490.383 mln
-27.19%
jan 1, 1964
2.249 bln
+935.862 mln
71.27%
jan 1, 1965
2.4 bln
+151.566 mln
6.74%
jan 1, 1966
2.529 bln
+128.165 mln
5.34%
jan 1, 1967
2.473 bln
-55.915 mln
-2.21%
jan 1, 1968
2.52 bln
+47.442 mln
1.92%
jan 1, 1969
2.819 bln
+298.982 mln
11.86%
jan 1, 1970
3.062 bln
+243.066 mln
8.62%
jan 1, 1971
3.425 bln
+363.186 mln
11.86%
jan 1, 1972
3.754 bln
+328.698 mln
9.6%
jan 1, 1973
4.799 bln
+1.045 bln
27.84%
jan 1, 1974
5.735 bln
+935.54 mln
19.49%
jan 1, 1975
7.493 bln
+1.758 bln
30.66%
jan 1, 1976
9.937 bln
+2.444 bln
32.61%
jan 1, 1977
10.764 bln
+826.729 mln
8.32%
jan 1, 1978
13.472 bln
+2.709 bln
25.16%
jan 1, 1979
16.455 bln
+2.983 bln
22.14%
jan 1, 1980
19.671 bln
+3.216 bln
19.54%
jan 1, 1981
24.104 bln
+4.434 bln
22.54%
jan 1, 1982
26.299 bln
+2.194 bln
9.1%
jan 1, 1983
27.481 bln
+1.183 bln
4.5%
jan 1, 1984
29.423 bln
+1.941 bln
7.06%
jan 1, 1985
35.759 bln
+6.336 bln
21.53%
jan 1, 1986
39.739 bln
+3.98 bln
11.13%
jan 1, 1987
48.894 bln
+9.155 bln
23.04%
jan 1, 1988
51.113 bln
+2.219 bln
4.54%
jan 1, 1989
46.95 bln
-4.163 bln
-8.15%
jan 1, 1990
44.395 bln
-2.555 bln
-5.44%
jan 1, 1991
45.233 bln
+838.516 mln
1.89%
jan 1, 1992
28.636 bln
-16.597 bln
-36.69%
jan 1, 1993
32.543 bln
+3.906 bln
13.64%
jan 1, 1994
36.093 bln
+3.551 bln
10.91%
jan 1, 1995
31.244 bln
-4.849 bln
-13.43%
jan 1, 1996
30.025 bln
-1.219 bln
-3.9%
jan 1, 1997
32.158 bln
+2.132 bln
7.1%
jan 1, 1998
32.753 bln
+595.723 mln
1.85%
jan 1, 1999
35.076 bln
+2.322 bln
7.09%
jan 1, 2000
33.261 bln
-1.815 bln
-5.17%
jan 1, 2001
30.219 bln
-3.041 bln
-9.14%
jan 1, 2002
32.018 bln
+1.799 bln
5.95%
jan 1, 2003
33.756 bln
+1.738 bln
5.43%
jan 1, 2004
37.52 bln
+3.763 bln
11.15%
jan 1, 2005
44.652 bln
+7.132 bln
19.01%
jan 1, 2006
46.658 bln
+2.006 bln
4.49%
jan 1, 2007
50.249 bln
+3.592 bln
7.7%
jan 1, 2008
58.489 bln
+8.239 bln
16.4%
jan 1, 2009
74.196 bln
+15.707 bln
26.86%
jan 1, 2010
73.689 bln
-507.571 mln
-0.68%
jan 1, 2011
83.098 bln
+9.409 bln
12.77%
jan 1, 2012
103.696 bln
+20.599 bln
24.79%
jan 1, 2013
109.684 bln
+5.988 bln
5.77%
jan 1, 2014
112.834 bln
+3.15 bln
2.87%
jan 1, 2015
119.24 bln
+6.405 bln
5.68%
Ranking of countries by current statistics by years


Comments: