29
/
en
AIzaSyAYiBZKx7MnpbEhh9jyipgxe19OcubqV5w
April 1, 2024
104833
Chile
CHL
true
2
1
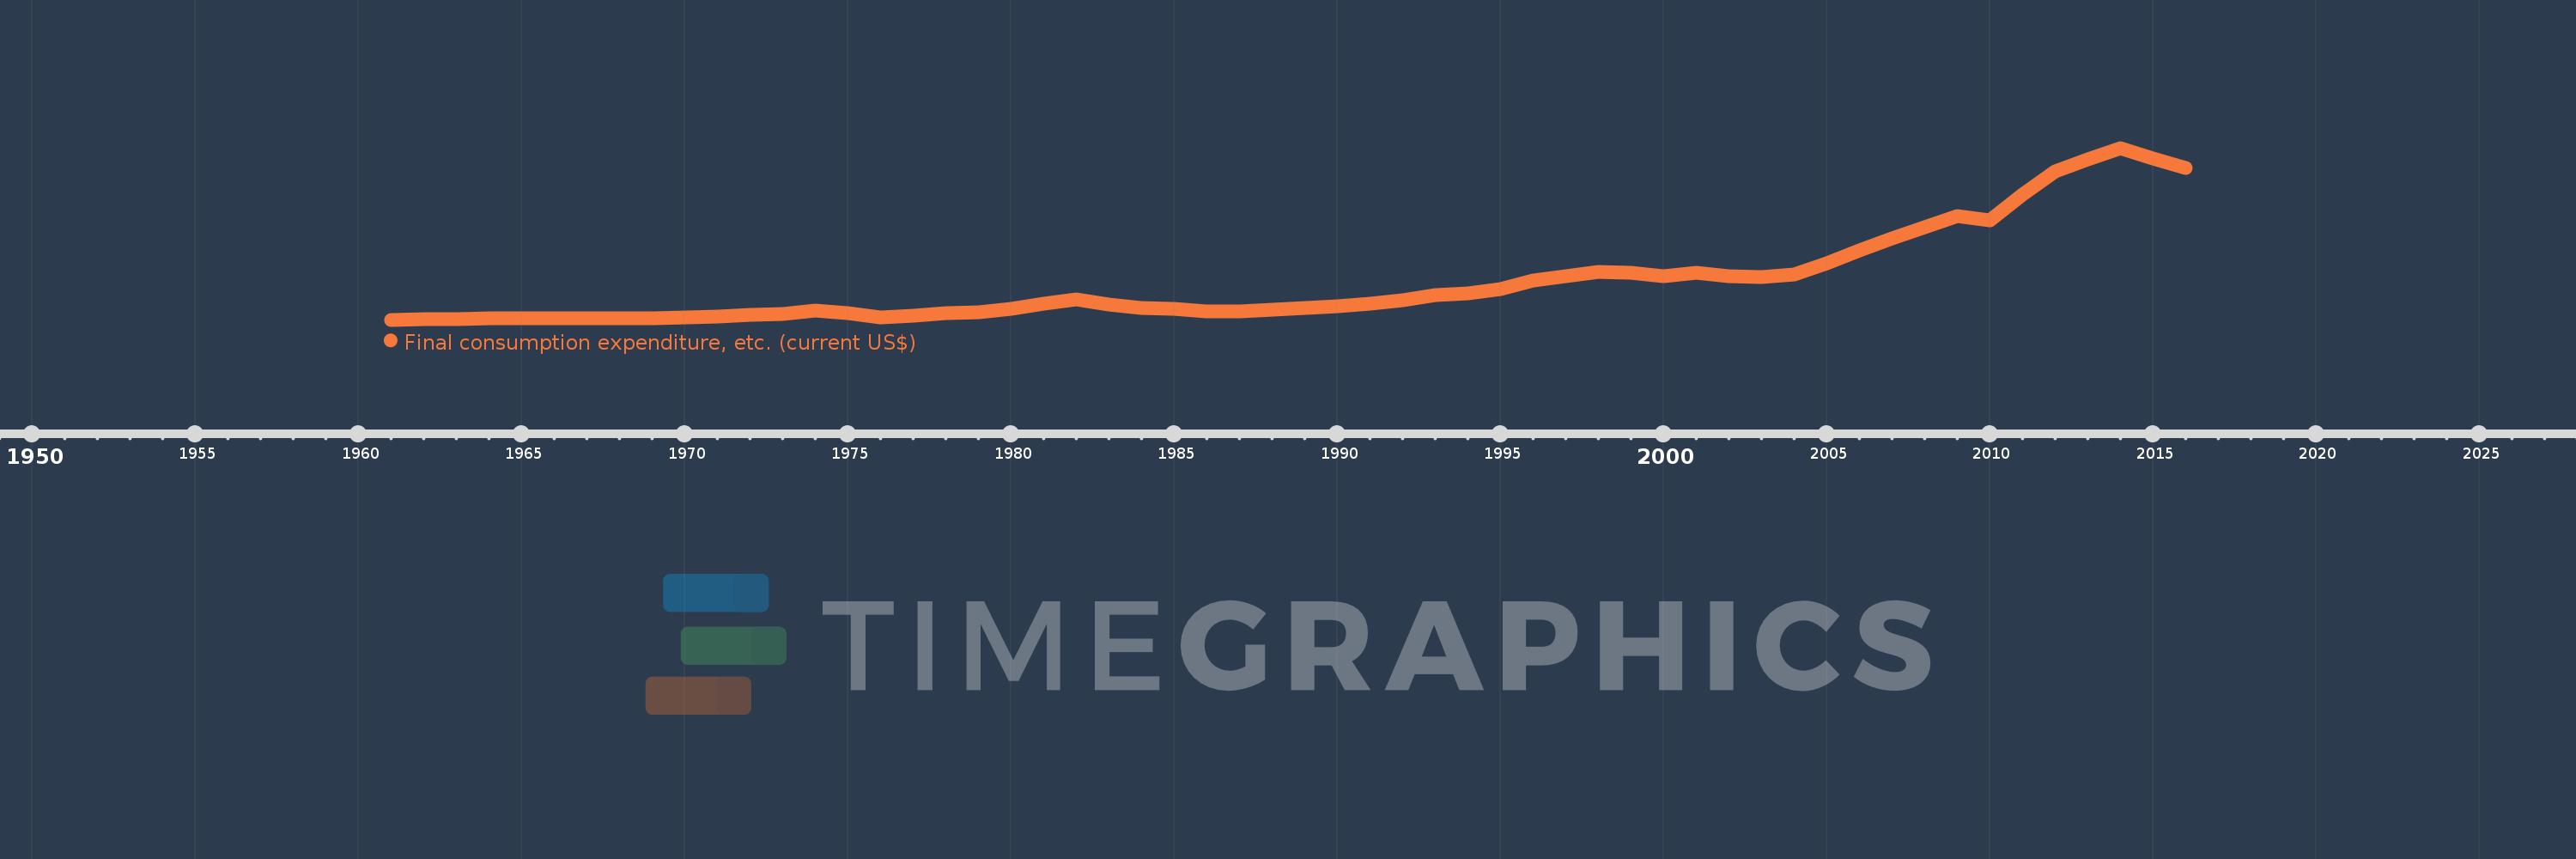
Final consumption expenditure, etc. (current US$)
2016,2015,2014,2013,2012,2011,2010,2009,2008,2007,2006,2005,2004,2003,2002,2001,2000,1999,1998,1997,1996,1995,1994,1993,1992,1991,1990,1989,1988,1987,1986,1985,1984,1983,1982,1981,1980,1979,1978,1977,1976,1975,1974,1973,1972,1971,1970,1969,1968,1967,1966,1965,1964,1963,1962,1961
This statistics in other country:
AfghanistanAlbaniaAlgeriaAngolaAntigua and BarbudaArab WorldArgentinaArmeniaArubaAustraliaAustriaAzerbaijanBahamas, TheBahrainBangladeshBarbadosBelarusBelgiumBelizeBeninBermudaBhutanBoliviaBosnia and HerzegovinaBotswanaBrazilBrunei DarussalamBulgariaBurkina FasoBurundiCabo VerdeCambodiaCameroonCanadaCaribbean small statesCentral African RepublicCentral Europe and the BalticsChadChileChinaColombiaComorosCongo, Dem. Rep.Congo, Rep.Costa RicaCote d'IvoireCroatiaCubaCyprusCzech RepublicDenmarkDjiboutiDominicaDominican RepublicEarly-demographic dividendEast Asia & PacificEast Asia & Pacific (excluding high income)East Asia & Pacific (IDA & IBRD countries)EcuadorEgypt, Arab Rep.El SalvadorEquatorial GuineaEritreaEstoniaEthiopiaEuro areaEurope & Central AsiaEurope & Central Asia (excluding high income)Europe & Central Asia (IDA & IBRD countries)European UnionFaroe IslandsFijiFinlandFragile and conflict affected situationsFranceGabonGambia, TheGeorgiaGermanyGhanaGreeceGrenadaGuatemalaGuineaGuinea-BissauGuyanaHaitiHeavily indebted poor countries (HIPC)High incomeHondurasHong Kong SAR, ChinaHungaryIBRD onlyIcelandIDA & IBRD totalIDA blendIDA onlyIDA totalIndiaIndonesiaIran, Islamic Rep.IraqIrelandIsraelItalyJamaicaJapanJordanKazakhstanKenyaKiribatiKorea, Rep.KosovoKuwaitKyrgyz RepublicLao PDRLate-demographic dividendLatin America & Caribbean Latin America & Caribbean (excluding high income)Latin America & the Caribbean (IDA & IBRD countries)LatviaLeast developed countries: UN classificationLebanonLesothoLiberiaLibyaLithuaniaLow & middle incomeLow incomeLower middle incomeLuxembourgMacao SAR, ChinaMacedonia, FYRMadagascarMalawiMalaysiaMaldivesMaliMaltaMauritaniaMauritiusMexicoMicronesia, Fed. Sts.Middle East & North AfricaMiddle East & North Africa (excluding high income)Middle East & North Africa (IDA & IBRD countries)Middle incomeMoldovaMongoliaMontenegroMoroccoMozambiqueNamibiaNepalNetherlandsNew CaledoniaNew ZealandNicaraguaNigerNigeriaNorth AmericaNorwayOECD membersOmanOther small statesPakistanPanamaPapua New GuineaParaguayPeruPhilippinesPolandPortugalPost-demographic dividendPre-demographic dividendPuerto RicoQatarRomaniaRussian FederationRwandaSaudi ArabiaSenegalSerbiaSeychellesSierra LeoneSingaporeSlovak RepublicSloveniaSmall statesSolomon IslandsSouth AfricaSouth AsiaSouth Asia (IDA & IBRD)South SudanSpainSri LankaSt. Kitts and NevisSt. LuciaSt. Vincent and the GrenadinesSub-Saharan Africa Sub-Saharan Africa (excluding high income)Sub-Saharan Africa (IDA & IBRD countries)SudanSurinameSwazilandSwedenSwitzerlandSyrian Arab RepublicTajikistanTanzaniaThailandTimor-LesteTogoTongaTrinidad and TobagoTunisiaTurkeyTurkmenistanUgandaUkraineUnited Arab EmiratesUnited KingdomUnited StatesUpper middle incomeUruguayUzbekistanVanuatuVenezuela, RBVietnamWest Bank and GazaWorldYemen, Rep.ZambiaZimbabwe Timeline:
This timeline shows a graph from 1961 to 2016 of Chile. No data until 1960. Number of actual observations by date: 56.
Source name:
World Development Indicators
Source organization:
World Bank national accounts data, and OECD National Accounts data files.
Categories, topics:
Economy & Growth
Last updated:
apr 23, 2017
Indicators value changes by year
Minimum:
3.438 bln
jan 1, 1961
Maximum:
211.518 bln
jan 1, 2014
At the date of observation
Value
Absolute change
Change from previous value
jan 1, 1961
3.438 bln
+3.438 bln
0.0%
jan 1, 1962
3.891 bln
+453.0 mln
13.18%
jan 1, 1963
4.604 bln
+712.727 mln
18.32%
jan 1, 1964
4.722 bln
+118.313 mln
2.57%
jan 1, 1965
4.886 bln
+163.209 mln
3.46%
jan 1, 1966
4.819 bln
-66.772 mln
-1.37%
jan 1, 1967
5.538 bln
+719.712 mln
14.94%
jan 1, 1968
5.504 bln
-34.54 mln
-0.62%
jan 1, 1969
5.654 bln
+149.702 mln
2.72%
jan 1, 1970
6.551 bln
+897.54 mln
15.88%
jan 1, 1971
7.188 bln
+637.333 mln
9.73%
jan 1, 1972
8.968 bln
+1.78 bln
24.76%
jan 1, 1973
10.248 bln
+1.28 bln
14.27%
jan 1, 1974
14.978 bln
+4.73 bln
46.16%
jan 1, 1975
11.572 bln
-3.406 bln
-22.74%
jan 1, 1976
6.143 bln
-5.429 bln
-46.92%
jan 1, 1977
7.884 bln
+1.741 bln
28.34%
jan 1, 1978
11.283 bln
+3.399 bln
43.11%
jan 1, 1979
12.676 bln
+1.393 bln
12.35%
jan 1, 1980
16.952 bln
+4.276 bln
33.73%
jan 1, 1981
22.922 bln
+5.971 bln
35.22%
jan 1, 1982
28.61 bln
+5.687 bln
24.81%
jan 1, 1983
22.052 bln
-6.558 bln
-22.92%
jan 1, 1984
17.29 bln
-4.762 bln
-21.6%
jan 1, 1985
16.816 bln
-474.402 mln
-2.74%
jan 1, 1986
13.25 bln
-3.565 bln
-21.2%
jan 1, 1987
13.834 bln
+583.438 mln
4.4%
jan 1, 1988
15.661 bln
+1.827 bln
13.21%
jan 1, 1989
17.326 bln
+1.666 bln
10.64%
jan 1, 1990
19.868 bln
+2.541 bln
14.67%
jan 1, 1991
22.527 bln
+2.659 bln
13.39%
jan 1, 1992
26.587 bln
+4.06 bln
18.02%
jan 1, 1993
33.006 bln
+6.419 bln
24.14%
jan 1, 1994
35.801 bln
+2.795 bln
8.47%
jan 1, 1995
40.53 bln
+4.728 bln
13.21%
jan 1, 1996
51.097 bln
+10.567 bln
26.07%
jan 1, 1997
56.301 bln
+5.204 bln
10.18%
jan 1, 1998
61.607 bln
+5.307 bln
9.43%
jan 1, 1999
60.615 bln
-991.713 mln
-1.61%
jan 1, 2000
56.079 bln
-4.537 bln
-7.48%
jan 1, 2001
60.727 bln
+4.649 bln
8.29%
jan 1, 2002
56.239 bln
-4.489 bln
-7.39%
jan 1, 2003
55.041 bln
-1.198 bln
-2.13%
jan 1, 2004
58.496 bln
+3.456 bln
6.28%
jan 1, 2005
72.146 bln
+13.65 bln
23.33%
jan 1, 2006
86.965 bln
+14.819 bln
20.54%
jan 1, 2007
102.029 bln
+15.065 bln
17.32%
jan 1, 2008
115.804 bln
+13.775 bln
13.5%
jan 1, 2009
129.455 bln
+13.651 bln
11.79%
jan 1, 2010
124.055 bln
-5.4 bln
-4.17%
jan 1, 2011
155.156 bln
+31.1 bln
25.07%
jan 1, 2012
183.408 bln
+28.252 bln
18.21%
jan 1, 2013
198.036 bln
+14.629 bln
7.98%
jan 1, 2014
211.518 bln
+13.482 bln
6.81%
jan 1, 2015
199.094 bln
-12.424 bln
-5.87%
jan 1, 2016
187.57 bln
-11.524 bln
-5.79%
Ranking of countries by current statistics by years


Comments: